
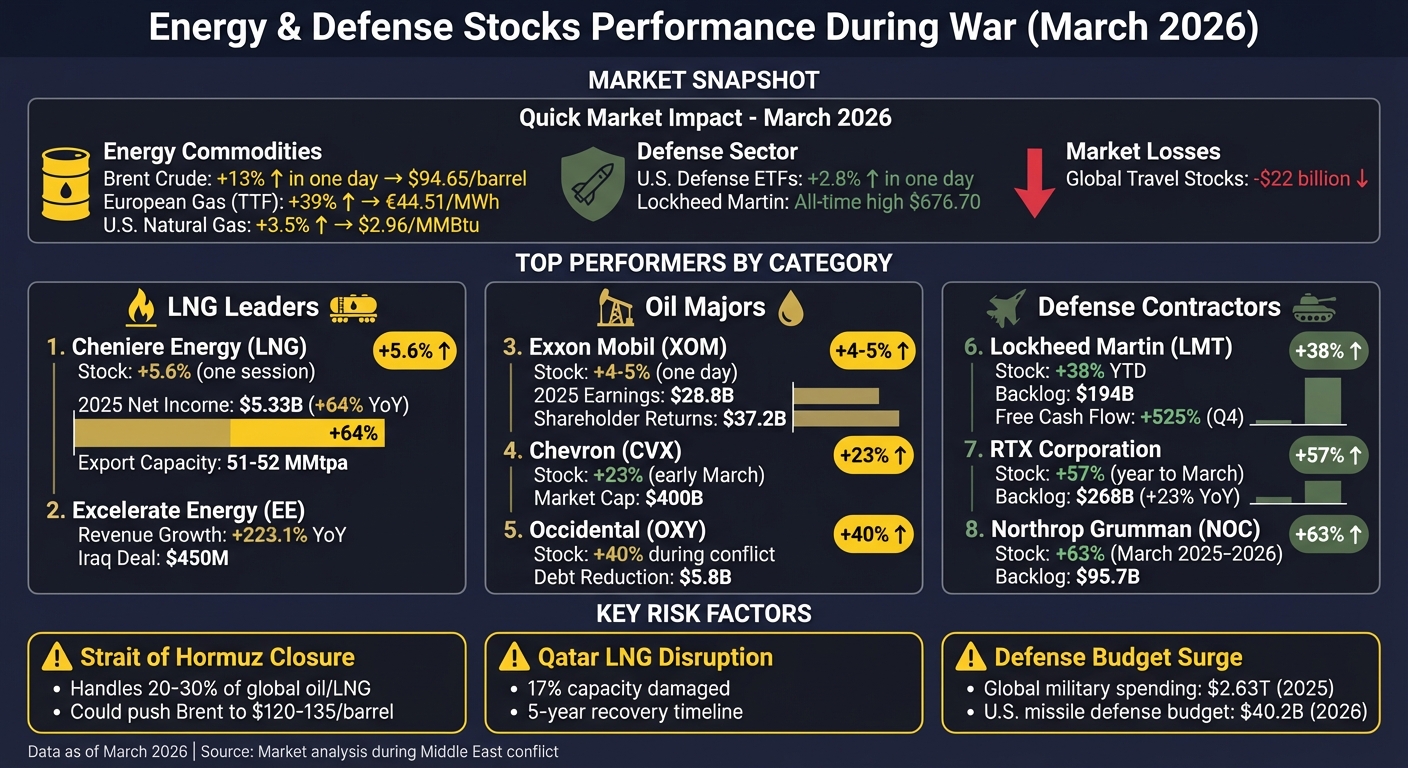
When geopolitical conflicts escalate, energy and defense stocks often become key investment opportunities. The ongoing Middle East tensions in March 2026 have significantly impacted markets, with Brent crude prices surging 13% in a single session and defense ETFs gaining 2.8% in one day. This article highlights 15 companies across LNG, oil, and defense sectors poised to benefit from rising commodity prices, increased military spending, and supply chain disruptions. Key takeaways:
- Energy Stocks (LNG & Oil): Companies like Cheniere Energy, Excelerate Energy, Exxon Mobil, and Chevron are thriving due to rising natural gas and crude oil prices, with Brent crude nearing $95 per barrel.
- Defense Stocks: Firms such as Lockheed Martin, Northrop Grumman, and RTX Corporation are benefiting from heightened global defense budgets, with record-breaking backlogs and increased production of key weapon systems.
- Market Trends: Airline and travel stocks have suffered losses, while U.S.-based energy producers and defense contractors gain from stable domestic operations and global demand.
Quick Market Snapshot:
- Brent crude prices surged 13% in one day, reaching $94.65.
- U.S. defense ETFs rose 2.8% in response to military escalations.
- Global travel stocks lost $22 billion due to rising fuel costs and reduced demand.
This guide explores how these companies are positioned to capitalize on the current geopolitical and market dynamics.
Energy and Defense Stocks Performance During March 2026 Middle East Conflict
1. LNG - Cheniere Energy - LNG Export / Natural Gas Infrastructure
Market Positioning During Geopolitical Conflicts
Cheniere Energy stands as a major player in the U.S. LNG market, controlling nearly 50% of the country’s export capacity. This key position links abundant American shale gas with energy-hungry global markets. For example, when Iranian attacks disrupted 17% of Qatar's LNG capacity, European gas prices spiked by 35%, leading to an urgent need for alternative suppliers. In response, Cheniere set a record in 2025 with 670 cargoes exported. The shift in European demand - from 34% of Cheniere’s exports in 2021 to 68% in 2025 - highlights the company’s strategic importance during such crises. This dominance allows Cheniere to thrive as commodity prices rise.
Exposure to Rising Commodity Prices
Cheniere benefits from a balanced revenue model, with about 90% of its volumes secured under long-term take-or-pay contracts and the remaining 10% exposed to spot market price fluctuations. This structure ensures stable cash flows while allowing the company to profit from price surges. For instance, in March 2026, as Euro-zone gas prices jumped 39% to €44.51 per megawatt-hour, Cheniere’s stock rose 5.6% in just one trading session.
The company’s financial performance reflects this strength. In 2025, Cheniere reported $5.33 billion in net income - a 64% increase from the prior year - on revenues that grew 27% to $19.98 billion. This growth was fueled by increased production and the completion of its Corpus Christi Stage 3 project. Jack Fusco, Cheniere’s President and CEO, summarized the year’s success:
"This commitment also enabled another record-setting year of LNG production in 2025, driving full year financial results to the high end of our guidance ranges".
Potential for Profit Growth Amid Supply Chain Disruptions
Cheniere’s integrated operations, covering everything from gas procurement to vessel chartering, provide a strong foundation to handle supply chain challenges effectively. The completion of the Corpus Christi Stage 3 project boosted exported volumes by 4%, with export capacity for 2026 expected to reach 51–52 million metric tonnes per annum. Looking ahead, the company forecasts adjusted EBITDA of $6.75–$7.25 billion for 2026 and has increased its share repurchase authorization to more than $10 billion through 2030. As of March 19, 2026, Cheniere’s stock was trading at $281.87, marking a 12.96% rise over the previous two weeks.
2. EE - Excelerate Energy - LNG Infrastructure (FSRU / Floating Terminals)
Market Positioning During Geopolitical Conflicts
Excelerate Energy operates one of the largest fleets of Floating Storage and Regasification Units (FSRUs), offering quick access to LNG without the need for permanent terminals. In October 2025, the company signed a $450 million deal with Iraq's Ministry of Electricity to establish the nation’s first floating LNG terminal at the Port of Khor Al Zubair. This project is a significant step for Iraq, as it reduces reliance on Iranian pipeline gas, which had already dropped from 50 million cubic meters per day to 25 million cubic meters per day earlier in 2025 due to sanctions and regional tensions. Steven Kobos, President and CEO of Excelerate Energy, highlighted the importance of this initiative:
"By combining terminal development, LNG supply, and operational expertise, we are helping Iraq secure reliable energy, diversify its fuel mix, and strengthen its long-term energy security".
FSRUs have a distinct advantage - they can be deployed within one to three years, far quicker than the four to six years required for traditional land-based terminals. Thomas Lersten, a senior official at the U.S. Department of State, also pointed out the broader geopolitical implications:
"This terminal opportunity demonstrates U.S. energy leadership and represents a vital step in advancing Iraq's energy security and reducing its reliance on Iranian pipeline gas".
This approach not only strengthens Excelerate's position in the market but also aligns with shifting energy dynamics during periods of geopolitical instability.
Exposure to Rising Commodity Prices
Excelerate Energy’s business model thrives on LNG price fluctuations. For example, the company reported a massive 223.1% year-over-year revenue increase, reaching $622.9 million in a single quarter. In March 2026, Iranian strikes disrupted Qatari LNG production, forcing India to cut industrial gas supplies by 30%. This situation underscored the high value of flexible infrastructure like FSRUs, which can quickly tap into alternative global supplies. Moreover, the Iraq project secures a minimum contracted offtake of 250 million standard cubic feet per day under a five-year agreement, while the FSRU Hull 3407 has the capacity to deliver up to 1,000 million standard cubic feet per day. These factors position Excelerate to reap substantial financial benefits even during turbulent times in the energy market.
Potential for Profit Growth Amid Supply Chain Disruptions
Excelerate’s integrated supply model ensures control over the entire LNG value chain, even during volatile market conditions. In March 2025, the company acquired New Fortress Energy’s Jamaica business for $1.055 billion, securing long-term contracts through 2039. Notably, 86% of this contracted revenue is protected under take-or-pay agreements. With global LNG demand projected to grow by 60% by 2040, Excelerate’s fleet of 10 operational FSRUs is well-positioned to meet the needs of nations striving for energy independence amid prolonged conflicts. This ability to adapt to changing circumstances solidifies Excelerate’s reputation as a leading energy infrastructure provider during uncertain times.
3. XOM - Exxon Mobil - Integrated Oil & Gas
Market Positioning During Geopolitical Conflicts
Exxon Mobil's integrated energy operations - from exploration to refining - provide a buffer against market swings, especially during periods of geopolitical tension. A notable example occurred in March 2026, during the U.S.-Iran conflict. Exxon Mobil's stock climbed 4–5% in a single day, opening between $160 and $161. This surge coincided with a 10–13% increase in Brent crude prices, which reached around $80 per barrel, spurred by attacks near the Strait of Hormuz.
Exxon’s significant upstream presence in stable regions like the Permian Basin and Guyana allows it to quickly respond to supply-driven price hikes. By late 2025, Exxon was producing 4.7 million barrels of oil equivalent per day - its highest annual output in over four decades - with a market value of over $635 billion as of March 2026. Analysts warn that a prolonged closure of the Strait of Hormuz, which handles about 20% of global oil supply (21 million barrels daily), could push Brent crude prices beyond $135 per barrel.
This strategic positioning not only secures stable earnings but also allows Exxon to benefit significantly from rising commodity prices.
Exposure to Rising Commodity Prices
Exxon’s integrated business model ensures resilience during periods of high commodity prices. Rising crude values drive upstream profits while also improving downstream margins. In the fourth quarter of 2025, Exxon reported $6.5 billion in profits on $82.3 billion in revenue, contributing to full-year earnings of $28.8 billion. That same year, Exxon returned $37.2 billion to shareholders, including $17.2 billion in dividends and $20 billion in stock buybacks.
The company is also expanding into natural gas through the Golden Pass LNG project, set to begin production in early 2026. This move comes as U.S. natural gas prices rose 3.5% to $2.96 per MMBtu due to regional supply shocks. As Reuters observed:
"Exxon Mobil, with vast upstream operations in the Permian Basin and Guyana, stands to benefit directly from elevated crude values".
Potential for Profit Growth Amid Supply Chain Disruptions
Exxon Mobil’s disciplined capital strategy and price resilience position it to capitalize on global supply chain disruptions. By prioritizing debt reduction and shareholder returns, the company has insulated itself from international supply challenges. With global oil consumption expected to rise by 640,000 barrels per day in 2026, Exxon’s production capabilities leave it well-placed to take advantage of this growth.
The International Energy Agency highlighted the scale of current disruptions, stating:
"The ongoing Middle East conflict has caused the largest-ever oil supply disruption in history, surpassing even the shocks experienced during the 1973 oil crisis and the 1990 Gulf War".
4. CVX - Chevron - Integrated Oil & Gas
Market Positioning During Geopolitical Conflicts
Chevron's operations in the Permian Basin give it a significant edge, insulating the company from instability in the Middle East. For example, after tensions in Iran escalated, Chevron's stock jumped 23% by early March 2026, as investors leaned toward its reliable domestic production. By that time, Chevron's market cap had soared to $400 billion, with shares climbing over 30% year-to-date.
One of Chevron's standout strengths lies in its end-to-end integration, which bolsters its stability in domestic markets. The company has also maintained a presence in Venezuela, working to restore production. Additionally, Chevron is exploring opportunities to acquire non-Russian assets from Lukoil, a U.S.-sanctioned entity, which could allow it to tap into high-quality infrastructure displaced by geopolitical conflicts. These strategic moves position Chevron to benefit from rising commodity prices amid global uncertainties.
Run 24/7 while you sleep. Keep bots, platforms, and trade copiers online on a dedicated VPS.
Low-latency VPS hosting for your trading platform.
From $59.99/mo
Exposure to Rising Commodity Prices
Chevron has seen its profitability soar alongside Brent crude prices, which reached $85 per barrel in March 2026. Some analysts even predict that ongoing regional conflicts could push prices into triple digits. Between February 2022 and January 2026, Chevron joined four other global oil majors in generating $467 billion in combined profits, returning $444.4 billion to shareholders through dividends and stock buybacks. Dan Pickering, founder of Pickering Energy Partners, highlighted Chevron's advantage, stating:
"The U.S. is the biggest producer in the world, and our supplies are not bottlenecked. So [American producers'] financial results are absolutely going to benefit from this".
Chevron's refining operations also saw a boost during the conflict. The 3-2-1 crack spread - a measure of refining margins - jumped from $28.55 in late February 2026 to $44.33 by March 5, as fuel prices outpaced crude costs. This enabled Chevron to transfer higher costs to consumers while capturing additional margins.
Potential for Profit Growth Amid Supply Chain Disruptions
Chevron's strong market position and favorable pricing environment set the stage for significant profit growth. The company's strategic investments further enhance its ability to navigate supply chain challenges. For instance, its $53 billion acquisition of Hess, finalized in July 2025, is expected to contribute over 80% of its production growth through 2030. Chevron aims to reach a production rate of 4.2 million barrels of oil equivalent per day by 2030, up 13% from its 2025 projection of 3.7 million barrels per day. To address long-term inventory needs, Chevron has also committed to increasing its exploration budget by 50% through the end of the decade.
Industry analyst Chris MacDonald praised Chevron's approach, stating that it "is among the best players in the energy patch from a diversification and cash flow growth perspective" due to its ownership of "essentially the entire value creation lifecycle". This integrated structure ensures Chevron remains resilient, even when geopolitical disruptions or infrastructure challenges create stress within specific segments of the supply chain.
5. OXY - Occidental Petroleum - Oil & Gas Exploration & Production
Market Positioning During Geopolitical Conflicts
Occidental Petroleum (OXY) has strategically positioned itself to thrive during periods of geopolitical instability, especially when oil prices spike. A prime example of this was during the Iran conflict in March 2026. As a U.S.-based producer, OXY leveraged its domestic operations to capitalize on rising global oil prices caused by disruptions in the Middle East.
During the conflict, OXY's stock saw a 9% jump initially and ultimately climbed by 40%. Meanwhile, Brent crude prices surged nearly 70% in the same timeframe. Market analyst Itai Smidt highlighted the advantage of OXY's U.S. base:
"The United States is a net energy exporter, meaning domestic producers benefit from higher global prices without suffering the supply-chain disruptions hitting European and Asian competitors".
With an average resource breakeven of $38 per barrel and 84% of its portfolio profitable below $50 per barrel, OXY maintained strong margins, even as the "war premium" began to diminish.
Exposure to Rising Commodity Prices
OXY's low-cost production model ensures that it reaps substantial benefits when oil prices rise. For instance, when Brent crude jumped from under $80 to over $100 per barrel following military strikes in early 2026, OXY's efficient operations translated into significant profits. The company used this windfall to aggressively reduce its debt, cutting $5.8 billion in principal debt between mid-December 2025 and March 2026. This reduction brought its total debt down to approximately $15 billion, saving $365 million annually in interest expenses.
Despite the volatile market, OXY kept its 2026 capital budget between $5.5 billion and $5.9 billion, which was $550 million lower than the previous year. Additionally, the company increased its quarterly dividend by 8% to $0.26 per share in February 2026, effectively doubling its payout over the past four years. Matt DiLallo from The Motley Fool remarked:
"Occidental Petroleum wasn't expecting oil prices to surge this year... higher oil prices will enable Occidental Petroleum to produce an even bigger gusher of additional free cash flow this year".
Potential for Profit Growth Amid Supply Chain Disruptions
OXY's focus on the Permian Basin gives it a competitive edge, particularly during global supply chain disruptions. By concentrating on domestic production, the company avoids the shipping challenges that plague international competitors. In 2026, OXY aims to produce 1.45 million barrels of oil equivalent per day, with most of this output coming from U.S. operations. This domestic focus allows OXY to maintain steady production levels, even as European and Asian firms face tanker shortages and shipping route disruptions linked to the Strait of Hormuz closure.
Despite anticipating somewhat lower oil prices, OXY expects to generate over $1.2 billion in additional free cash flow in 2026 compared to 2025. Beyond traditional oil production, the company is diversifying its revenue streams with the STRATOS direct air capture project. This initiative ties revenue to carbon removal credits, reducing reliance on the unpredictable nature of commodity prices.
6. COP - ConocoPhillips - Upstream Oil & Gas Producer
Market Positioning During Geopolitical Conflicts
ConocoPhillips stands out as a safeguard against geopolitical instability, with 74% of its projected 2025 earnings tied to stable North American assets. These include the U.S. Lower 48, Alaska, and Canada, offering a stark contrast to competitors with significant exposure to more volatile regions like the Middle East. This focus on North America shields the company from potential disruptions stemming from geopolitical tensions elsewhere.
For instance, during the U.S.-Israeli strikes on Iran in March 2026, ConocoPhillips shares surged by 4.3% in just one day, coinciding with a 6.4% spike in WTI crude prices, which climbed above $71 per barrel. Billy Duberstein from The Motley Fool highlighted this advantage:
"ConocoPhillips is among the most exposed to the U.S. among large-cap oil stocks... its supply shouldn't be disrupted by the war".
This geographic strategy positions the company to capitalize on rising oil prices while minimizing risks tied to global conflicts.
Exposure to Rising Commodity Prices
As a company focused on upstream production, ConocoPhillips is particularly sensitive to fluctuations in oil prices. Producing approximately 2.33–2.36 million barrels of oil equivalent per day in early 2026, the company generated around $60.3 billion in revenue over the prior 12 months. Sergey Savastiouk, CEO of Tickeron, explained how price increases could benefit the company:
"For a large, low‑cost producer like ConocoPhillips, a sustained 10–20 dollar increase in benchmark prices would materially lift free cash flow".
With analysts predicting that Brent crude could hover between $90 and $100 per barrel if Middle Eastern supply issues persist, ConocoPhillips is well-positioned to see a significant boost in free cash flow from any price increases.
Potential for Profit Growth Amid Supply Chain Disruptions
ConocoPhillips continues to build on its solid earnings foundation, aiming for even greater profitability. The company's acquisition of Marathon Oil and progress on long-term projects like the Willow project in Alaska are expected to deliver over $1 billion in run-rate cost savings. Additionally, in 2025, the company achieved a 15% improvement in drilling and completion efficiency in the Lower 48, showcasing its operational strength.
With plans to return 45% of operating cash to shareholders in 2026 through dividends and buybacks, ConocoPhillips is taking advantage of the current high-price environment and geopolitical "war premium". Ryan Lance, Chairman and CEO, highlighted the company's strategic edge:
"Our best-in-class asset base remains a distinct competitive advantage, with the deepest and most capital-efficient Lower 48 inventory and a diverse, global portfolio of advantaged major projects and legacy assets".
7. EQT - EQT Corporation - Natural Gas Producer
Market Positioning During Geopolitical Conflicts
EQT Corporation, the largest natural gas producer in the U.S., has shown resilience during periods of geopolitical instability, particularly when conflicts in the Middle East disrupt global energy flows. For example, after Iranian drone attacks in March 2026, EQT's stock gained traction among investors. Unlike facilities in high-risk areas like Qatar's Ras Laffan or the Strait of Hormuz, EQT's North American operations remain unaffected by such disruptions. This domestic focus contributed to a 13% rise in EQT's stock between August 2025 and February 2026, bolstered by stronger natural gas prices and improved visibility into free cash flow. Natural gas, being less easily substituted and closely tied to industrial activity, allowed EQT's upstream cash flows to remain stable even during extended energy market shocks.
Exposure to Rising Commodity Prices
EQT's market strength extends to its ability to benefit from rising natural gas prices. In March 2026, natural gas benchmarks in the Euro-zone jumped 39% to €44.51 per megawatt-hour, while U.S. prices saw a smaller but notable increase of 3.5%, reaching $2.96 per MMBtu. With well costs per lateral foot dropping 13% year-over-year, these price increases translate directly into stronger free cash flow. For 2026, management has projected adjusted EBITDA of about $6.5 billion and free cash flow of roughly $3.5 billion. Analyst Nikko Henson highlighted this dynamic, stating:
"Lower structural costs allow incremental gas price strength to translate more directly into free cash flow, strengthening per-share value even without aggressive production growth".
This confidence is reflected in institutional investors holding approximately 91% of EQT's stock as of February 2026.
Potential for Profit Growth Amid Supply Chain Disruptions
EQT's strategic investments in infrastructure significantly enhance its ability to capture premium pricing and reduce market volatility. Projects like the Mountain Valley Pipeline and the Clarington Connector have opened access to high-demand regions, aligning with the growth of U.S. LNG exports as they fill supply gaps caused by Middle Eastern disruptions. In Q4 2025, EQT reported a 47% year-over-year revenue increase, reaching $2.39 billion. The company's average realized natural gas price rose 14.3% to $3.44 per thousand cubic feet equivalent during the same period. Analysts have set a target price of $74 per share, suggesting a 22% upside from its February 2026 price of $59. With a strong balance sheet - evidenced by a Net Debt/EBITDA ratio of 1.3x - EQT is well-positioned to seize emerging opportunities.
8. CHK - Chesapeake Energy - Natural Gas Producer
Market Positioning During Geopolitical Conflicts
Chesapeake Energy, now operating under the name Expand Energy after its merger with Southwestern Energy, stands as the largest natural gas producer in the U.S., with a production capacity of around 7 billion cubic feet per day. This scale makes the company a vital alternative to Middle Eastern energy sources, especially after missile attacks in March 2026 disrupted Qatari LNG infrastructure. Its shale reserves in the Marcellus and Haynesville basins are strategically located far from regions of conflict.
The company’s "Be LNG Ready" strategy represents a major shift from focusing solely on domestic sales to tapping into international markets. Management plans to allocate 15–20% of production volumes to international LNG pricing, allowing Chesapeake to bypass domestic market limitations and capture better margins globally. CEO Nick Dell'Osso highlighted the importance of this approach, stating:
"We don't see access to LNG as something that is a guaranteed arbitrage... We see it as a very important diversification strategy for our business".
This pivot to global LNG benchmarks underscores the company's efforts to strengthen its position in international markets while maintaining a strong domestic foothold.
Exposure to Rising Commodity Prices
Chesapeake’s profitability is closely tied to commodity price fluctuations. To reduce reliance on Henry Hub pricing, the company has embraced international benchmarks like the Japan Korea Marker (JKM). In 2024, Chesapeake secured a 15-year deal with Vitol to supply 1 million tonnes of LNG annually starting in 2028, indexed to JKM rather than domestic prices. This strategy paid off during the geopolitical disruptions of March 2026, enabling the company to benefit from a 35% surge in European gas prices.
Despite facing tough market conditions in 2023, Chesapeake achieved $2.4 billion in net income and returned approximately $840 million to shareholders through dividends and stock buybacks. The company’s operational flexibility - delaying completions during low-price periods and quickly activating its inventory of 75 drilled but uncompleted wells when prices rise - has proven to be a key advantage in navigating the volatility caused by geopolitical conflicts.
Potential for Profit Growth Amid Supply Chain Disruptions
Chesapeake has also managed to mitigate supply chain challenges by cutting capital and production costs by 4% and 8%, respectively, in 2024. Instead of maximizing output, the company focuses on maintaining strategic production capacity, building an inventory of short-cycle projects that can be deployed quickly when global demand spikes. Ben Marshall, Head of Vitol Americas, emphasized the evolving energy dynamics:
"The global energy landscape has changed significantly in the last two years, which has highlighted the importance of U.S. natural gas production and liquefaction in satisfying the world's energy needs".
With U.S. natural gas production expected to grow from 100 Bcf/d to 120 Bcf/d by the next decade, Chesapeake is well-positioned to capitalize on this expansion. The company’s first binding LNG export deal with the Delfin floating LNG project (0.5 mmty) marks the beginning of its international growth, solidifying its role as a major player in the global energy market during a time of heightened geopolitical tensions.
9. SHEL - Shell plc - Global Integrated Energy (Brent Exposure)
Market Positioning During Geopolitical Conflicts
Shell stands out as a key player during periods of geopolitical instability, offering direct exposure to rising oil prices. As a global energy giant, it benefits from a "quality bias", attracting investors seeking stability in volatile markets. For example, in March 2026, military actions in the Middle East caused Brent crude prices to spike 8.8%, reaching $79.25 per barrel. In response, Shell's share price climbed 3.7%. This close link to oil benchmarks is significant, especially considering that 20% to 30% of the world's oil and LNG supply passes through the Strait of Hormuz.
Shell’s diversified operations outside conflict-prone areas give it a strategic edge. James Hosie, an analyst at Shore Capital, highlighted this advantage:
"Higher near-term oil prices should continue to support the share prices of oil and gas producers operating outside the region and is a fresh reminder of the value of domestic energy security".
The company’s North Sea operations and its extensive global trading network allow it to fill supply gaps when disruptions occur in the Middle East. This operational diversity underpins Shell’s strong performance during uncertain times.
Exposure to Rising Commodity Prices
Shell’s integrated business model thrives as commodity prices increase. A $10 rise in Brent crude boosts its free cash flow yield by approximately two percentage points. Additionally, upstream production, which contributes 60% to 70% of earnings, experiences a 40% margin increase for every 13% rise in oil prices. This was evident in early March 2026, when UK natural gas prices surged by 25% to 98.5p per therm, reflecting Shell’s significant market presence.
In 2025, Shell generated $42.9 billion in cash flow from operations and began a $3.5 billion share buyback program in Q1 2026. The company’s focus on LNG expansion - aiming for 4% to 5% annual sales growth through 2030 - positions it well to benefit from rising regional benchmarks. For instance, European natural gas prices soared by 39% to €44.51 per megawatt-hour in March 2026, further enhancing Shell’s free cash flow.
Potential for Profit Growth Amid Supply Chain Disruptions
Shell’s integrated structure provides a buffer against supply chain disruptions. Since 2022, the company has achieved $5.1 billion in cost savings, surpassing its 2028 efficiency targets. Its agile trading operations also capitalize on regional price imbalances. With a gearing ratio of 20.7% and net debt at $45.7 billion, Shell remains financially flexible during periods of market instability.
Building on this solid foundation, Shell maintains a defensive stance in volatile markets. Devin McDermott, an analyst at Morgan Stanley, underscored this approach:
"We recommend sticking with what's working - remain defensive with a quality bias amid this period of heightened volatility".
Analysts predict that Brent crude could hit $120 per barrel if disruptions in the Strait of Hormuz persist for more than three weeks. Such a scenario would significantly boost upstream margins. Historically, regime changes in oil-producing nations have led to oil prices remaining 30% higher for at least three months, creating sustained profit opportunities for globally diversified companies like Shell.
10. BP - BP plc - Global Oil & Gas (Brent Exposure)
Market Positioning During Geopolitical Conflicts
BP's reliance on Brent crude has proven advantageous during times of geopolitical tension. For example, in early March 2026, Iran's blockade of the Strait of Hormuz - responsible for 20% of the world's oil supply - pushed Brent crude prices to a one-year high of $80 per barrel. This surge translated to a significant boost for BP, whose stock climbed 16% year-to-date by March 3, followed by an additional 9.6% rise over the next month. In contrast, competitors like ExxonMobil saw only a modest 0.9% gain during the same period.
Under CEO Murray Auchincloss, BP has shifted its strategy to capitalize on these market dynamics. Pressured by Elliott Management, which acquired a 5.006% stake in 2025, BP abandoned its ambitious renewable energy expansion plans in February 2026. Instead, the company redirected its focus to seven major upstream projects launched in 2025, designed to maximize cash flow when Brent prices exceed $70 per barrel. Financial writer Michael Abadha summed up the situation:
"The closure of the Strait of Hormuz has pushed Brent crude to $80, which is directly increasing BP's profit margins and attracting investors who want a safe investment during this conflict".
Exposure to Rising Commodity Prices
BP's performance is closely tied to Brent crude prices, the benchmark for its global upstream operations and trading activities. JPMorgan analysts have suggested that a prolonged closure of the Strait of Hormuz could push Brent prices to between $120 and $130 per barrel. With BP currently trading at a forward P/E ratio of under 9x, this scenario could present a significant opportunity for growth in a high-price environment.
Stay online and closer to execution. Choose a VPS location for CME futures, New York markets, London FX, API trading, and more.
Host your platform near the market route that matters.
From $59.99/mo
The company's integrated business model - covering upstream production, refining, and a sophisticated trading division - positions it to benefit from tighter fuel markets during supply disruptions. By the end of 2025, BP had reduced its net debt to $22.2 billion and achieved a 14% Return on Average Capital Employed. Additionally, its dividend yield exceeds 5%, supported by a policy targeting 4% annual growth. Zacks Equity Research highlighted this advantage:
"BP's upstream activities have substantial exposure to rising oil prices and are expected to support higher profits and cash flows".
Potential for Profit Growth Amid Supply Chain Disruptions
In February 2026, CEO Murray Auchincloss paused BP's share buyback program to prioritize debt reduction and a $20 billion asset divestiture plan. As CFO Kate Thomson noted, net debt was expected to rise temporarily before declining later in the year. This move is part of BP's effort to streamline its portfolio toward high-margin assets while maintaining flexibility.
BP's operational strength adds to its stability during supply chain challenges. In 2025, the company reported 96.1% upstream plant reliability and 96.3% refining availability. Its robust trading desk and refining capabilities allow BP to capitalize on regional price imbalances caused by shipping disruptions. However, a swift resolution to the conflict could remove the "war premium" on oil prices, potentially leading to a stock correction. This strategic approach underscores BP's ability to adapt to volatile market conditions, setting the stage for further insights into global energy players in the next section.
11. TTE - TotalEnergies - Global Energy / LNG & Oil
Market Positioning During Geopolitical Conflicts
TotalEnergies stands out among Western energy companies due to its significant presence in the Middle East, where 29% of its production is based. This includes key operations in the United Arab Emirates and a strategic partnership with QatarEnergy, the state-owned company responsible for about 20% of the global LNG supply.
The U.S.-Israel-Iran conflict in March 2026 posed a major challenge for the French energy firm. Iranian drone strikes disrupted 17% of Qatar's LNG production capacity, with recovery expected to take up to five years, directly impacting TotalEnergies' projects in the region. This supply disruption caused European natural gas benchmarks to spike by 40%, reaching €44.51 per megawatt-hour, while Brent crude futures rose 7% to $77.74 per barrel. Reuters summarized the situation well:
"Even as the war threatens some production, it has caused a surge in oil and gas prices that could help prop up the companies' profits".
These geopolitical tensions highlight the volatility of energy markets and the delicate balance companies like TotalEnergies must navigate.
Commodity Price Exposure
TotalEnergies' wide-ranging global portfolio positions it to capitalize on rising energy prices, even in the face of regional instability. The closure of the Strait of Hormuz forced the company to rely on alternative supply chains and take advantage of higher spot prices. Its operations span upstream, refining, and LNG markets, allowing it to benefit from regional price differences.
With 29% of its production tied to the Middle East, TotalEnergies faces more exposure to regional risks than competitors like Exxon Mobil and Shell, which each have 20% of their output in the region. This concentrated presence creates a distinct risk-reward scenario for the company. As TradingKey noted:
"In a landscape ruled by uncertainty, [energy stocks] have become the market's few reliable hedges against geopolitical risk".
This dynamic underscores the potential for profit gains, even amid supply chain challenges.
Profit Growth Prospects
TotalEnergies faces a balancing act between operational risks and financial opportunities. While disruptions in crude and LNG transit through the Strait of Hormuz pose challenges, the resulting price spikes could help mitigate losses from reduced volumes. Elevated spot prices, driven by scarcity, have the potential to generate significant profits, offsetting the impact of facility shutdowns. The company's financial performance will largely depend on how long these disruptions persist and whether commodity prices remain elevated during that time.
12. LMT - Lockheed Martin - Defense / Aerospace

Market Positioning During Geopolitical Conflicts
Lockheed Martin has become known as "geopolitical insurance". During the 2025–2026 military operations in Iran, particularly in Operation Epic Fury, its F‑35 Lightning II aircraft and PAC‑3 missiles played a critical role. These systems successfully countered S‑400 defenses and neutralized various threats. The Pentagon has shifted its focus from merely restocking supplies to actively funding multi-front air and missile campaigns, which has directly benefited Lockheed's advanced systems.
As of 2026, Lockheed Martin entered the year with a record-breaking $194 billion backlog. This backlog, which grew by 8% year-over-year, reflects surging global demand as NATO and Asian allies ramp up defense budgets, often exceeding the traditional 2% of GDP threshold. One TipRanks analyst aptly summarized the company's position:
"Lockheed Martin stands as the indispensable titan of a more dangerous age."
This strategic shift highlights Lockheed Martin's critical role in addressing wartime needs and maintaining its leadership in defense technology.
Defense Sector Relevance During Wartime
Lockheed Martin's unmatched industrial scale sets it apart in the defense industry. In 2025 alone, it delivered 191 F‑35 fighter jets, making it a key player in meeting global demand for stealth aircraft. This capacity became even more vital as rising ballistic missile threats in the Middle East drove unprecedented demand for its PAC‑3 and THAAD interceptor systems.
In early 2026, Lockheed secured a $9.8 billion contract for 1,970 Patriot PAC‑3 interceptors, marking the largest deal ever for its Missiles and Fire Control division. To meet this growing demand, the company is ramping up THAAD production from 96 units annually to 400 units per year and has opened a new Munitions Acceleration Center in Camden, Arkansas. Once integrated into national defense systems, these products generate long-term revenue streams that are difficult to replace.
Potential for Profit Growth Amid Supply Chain Disruptions
Lockheed Martin's focus on active military operations has significantly boosted its financial performance. As of March 2, 2026, the company's stock had risen 38% year-to-date, with free cash flow surging by 525% in Q4 2025. For fiscal year 2026, annual earnings are expected to grow by 29%, increasing to $29.87 per share from $23.12 in FY2025.
To support this growth and address supply chain challenges, Lockheed is investing $3.5 billion to expand its production capacity. This shift from low-volume development to high-volume manufacturing not only improves margins but also positions the company to capitalize on ongoing increases in defense spending. With its stock trading at around 22x consensus 2026 earnings estimates, Lockheed Martin remains a standout asset in the defense sector.
13. NOC - Northrop Grumman - Defense / Aerospace

Market Positioning During Geopolitical Conflicts
Northrop Grumman holds a unique position in the defense sector, thanks to its exclusive role in developing the B-21 Raider stealth bomber and leading the Sentinel intercontinental ballistic missile (ICBM) program. These programs underscore the company's dominance in strategic deterrence, a critical area of modern defense. This positioning gained even more relevance after U.S. and Israeli military actions in the Middle East in March 2026, which reignited global demand for stealth technology and precision weaponry.
By early 2026, Northrop Grumman reported a record-breaking backlog of $95.7 billion. This robust order book provides a clear picture of the company’s long-term revenue potential, offering stability even during times of geopolitical uncertainty. In 2025, the company maintained a 1.10 book-to-bill ratio, meaning it received 10% more in new orders than it billed. This solid performance not only ensures steady revenue but also highlights the company’s essential role in addressing modern defense needs.
Defense Sector Relevance During Wartime
The March 2026 Iran conflict prompted a shift in investor behavior, with many moving away from technology stocks and toward defense companies like Northrop Grumman as a safer option during geopolitical turmoil. Joe Tenebruso, an analyst, aptly summarized this trend:
"Defense companies can be safe havens during times of war." - Joe Tenebruso
Northrop Grumman’s Aeronautics segment saw an 18% increase in sales by the fourth quarter of 2025, largely due to ramped-up production of the B-21 Raider. Unlike companies focused on tactical fighter jets, Northrop Grumman emphasizes long-range strike capabilities and nuclear deterrence - key priorities during periods of global instability. Additionally, in December 2025, the company secured a $764 million contract with the Space Development Agency, further cementing its position in the evolving landscape of digital and space-based warfare.
Potential for Profit Growth Amid Supply Chain Disruptions
Between March 2025 and March 2026, Northrop Grumman’s stock price soared 63%, rising from $465.90 to $759.10. This impressive growth came despite modest revenue increases of 2.2%, as the company’s price-to-earnings (P/E) multiple jumped 59.4% to 25.9. Free cash flow for the full year 2025 increased by 26%, reaching $3.3 billion - a testament to the company’s operational efficiency even amid supply chain challenges.
The B-21 program, once a costly development effort, is now transitioning to high-volume production, marking a key turning point for profitability. Analysts on Wall Street have given the stock a "Moderate Buy" rating, with price targets as high as $849, suggesting an additional 11.4% upside from its March 2026 levels. With global military spending climbing to $2.63 trillion in 2025, up from $2.48 trillion in 2024, Northrop Grumman is well-positioned to benefit from sustained growth in defense budgets worldwide.
14. RTX - RTX Corporation (Raytheon) - Defense / Missile Systems

Market Positioning During Geopolitical Conflicts
RTX Corporation, through its Raytheon division, has established itself as a leader in precision-guided munitions and air-defense systems. The company produces weapons like the Tomahawk cruise missile, AMRAAM air-to-air missiles, and the Standard Missile (SM) family, all of which played key roles in U.S. military actions, including Operation Epic Fury in 2026. By the end of 2025, RTX reported a staggering US$268 billion backlog, a 23% increase from the previous year, with US$107 billion tied directly to defense programs. This massive backlog ensures steady revenue for the years ahead and positions RTX as a major player in what’s being called a "Security Supercycle", where a focus on deterrence replaces just-in-time procurement. Reflecting investor confidence, RTX's stock price climbed 57% in the year leading to March 2026, as defense stocks gained appeal as safe investments during times of geopolitical tension.
Defense Sector Relevance During Wartime
RTX’s global footprint and integration into international defense systems further solidify its role in the defense sector. The company supplies interceptors for Israel’s Iron Dome and David’s Sling systems and provides radar components for the THAAD anti-ballistic defense system. Frequent missile and drone attacks necessitate constant replenishment of interceptors, ensuring ongoing demand. This is underscored by the fiscal 2026 U.S. defense budget, which allocated US$40.2 billion to missile defense - up significantly from US$13.5 billion in 2025 - and US$35.7 billion for missiles and munitions.
To meet rising demand, RTX signed groundbreaking seven-year framework agreements with the U.S. government in February 2026. These agreements aim to double or quadruple production rates for key missile programs. For example, RTX plans to produce over 1,000 Tomahawk missiles annually and at least 1,900 AMRAAMs, with AMRAAM production nearly doubling in 2025 compared to 2024. Speaking on this partnership, CEO and Chairman Chris Calio remarked:
"These agreements redefine how government and industry can partner to speed the delivery of critical technologies... to ensure the United States and its allies and partners have the decisive edge."
Potential for Profit Growth Amid Supply Chain Disruptions
Even with ongoing supply chain challenges, RTX has managed to streamline operations to drive profitability. In 2025, the company reported total sales of US$88.6 billion, with adjusted earnings per share increasing by 10% to US$6.29. By leveraging digital tools, RTX achieved a 35% reduction in circuit card cycle times at its Raytheon Andover site and cut aged inventory by 45% at its Pratt & Whitney Lansing facility. These improvements boosted munitions output by 20%.
Looking ahead, RTX is making significant investments to expand its production capacity. The company has earmarked US$3.1 billion for capital expenditures in 2026 to address bottlenecks in critical components like solid rocket motors and castings, directly supporting the production increases outlined in its government agreements. Management forecasts 2026 sales between US$92–93 billion, with free cash flow projected at US$8.25–8.75 billion. As of mid-March 2026, RTX shares traded around US$205–206, with analysts setting price targets as high as US$238. The company’s Price-to-Earnings ratio of 41.20 reflects the premium investors place on defense stocks amid global uncertainty.
15. GD - General Dynamics - Defense / Military Systems
Market Positioning During Geopolitical Conflicts
In times of global unrest, defense contractors like General Dynamics (GD) often see their operations thrive. GD stands out with its four key segments: Marine Systems (submarines and warships), Combat Systems (armored vehicles and land platforms), Technologies (IT services and cybersecurity), and Aerospace (Gulfstream private jets). This diversified approach has cemented its reputation as a major defense contractor. In FY2025, the company reported $52.6 billion in revenue, marking a 10% jump from the previous year, while net earnings rose by 11.3%. The year closed with a record-breaking $118 billion backlog and a book-to-bill ratio of 1.6x, indicating that new orders exceeded billed revenue by 60%. By March 2026, GD's stock had already climbed 8.25% year-to-date. These figures underline the company's strong positioning and critical role in supporting defense efforts during conflicts.
Defense Sector Relevance During Wartime
General Dynamics has established itself as a leader in both naval and land defense systems. Its portfolio includes nuclear-powered submarines, surface warships, and the M1 Abrams tank - key assets in conventional warfare and maritime security. But GD's contributions go beyond physical hardware; it also provides the U.S. military with vital command-and-control systems, secure communication networks, and cybersecurity solutions - essential tools for modern digital warfare. As global military spending surged to an estimated $2.63 trillion in 2025, up from $2.48 trillion in 2024, the defense sector entered what analysts call a "Defense Super-Cycle", benefiting major players like General Dynamics.
Potential for Profit Growth Amid Supply Chain Disruptions
Despite global supply chain challenges, General Dynamics has shown resilience and steady growth. In 2025, the company generated $3.9 billion in free cash flow. During Q3 2025, GD surpassed expectations with quarterly revenues of $12.91 billion, outperforming analysts' forecasts by 3.1%. Chairman and CEO Phebe Novakovic highlighted the company’s momentum, stating:
"Each of our four segments grew earnings and backlog in the quarter, reflecting solid execution coupled with growing demand."
Market analysts have set an average price target of $393.30 for GD shares, with a high estimate of $444, suggesting a potential stock rally of up to 21.7% over the next year. By March 2026, GD’s market valuation was approximately $98.6 billion. These performance metrics underscore General Dynamics' stability and growth potential, making it an appealing investment choice in uncertain times.
How QuantVPS Supports Energy and Defense Stock Trading
Energy and defense stocks often see dramatic price swings during geopolitical crises. For instance, disruptions in the Strait of Hormuz have previously caused Brent crude prices to spike nearly 40% and European gas prices to jump 60% in short timeframes. In such volatile moments, milliseconds can make all the difference. QuantVPS provides ultra-low latency connections - down to just 1 millisecond - to major exchanges, a stark contrast to the 50–100 millisecond latency typical of standard home internet setups. Research highlights the importance of speed, with findings showing that reducing execution latency by even 1 millisecond can boost high-frequency trading (HFT) strategy returns by 5% to 15% annually. As fintech entrepreneur Ace Zhuo explains:
"The difference between success and failure in HFT isn't strategy complexity or market knowledge – it's whether your orders reach the exchange 0.5 milliseconds before the next trader's".
This speed advantage is essential for traders aiming to capitalize on the rapid fluctuations in energy and defense markets.
QuantVPS pairs this speed with flexible pricing options to suit different trading needs. The platform offers eight pricing tiers, starting with the VPS Lite plan at $41.99 per month (billed annually). This plan includes 4 cores, 8GB RAM, and 70GB NVMe storage, making it ideal for traders managing 1–2 charts. For those handling 5–7 charts, the VPS Ultra plan costs $132.99 per month (annual billing) and provides 24 cores, 64GB RAM, and 500GB NVMe storage. Institutional traders managing 7+ charts can choose the Dedicated Server plan for $209.99 per month (billed annually), which delivers 16+ dedicated cores, 128GB RAM, and over 2TB of NVMe storage. Annual billing offers savings of up to 36% compared to monthly payments, and all plans come with a 14–30 day money-back guarantee for a risk-free trial.
Reliability is another cornerstone of QuantVPS, with the platform guaranteeing 99.95% to 99.99% uptime. This ensures that automated trading strategies remain operational, even if personal devices go offline. Servers are strategically placed in financial hubs like Chicago, New York, and London to reduce slippage during high-volatility events. The platform supports popular trading software such as NinjaTrader, MetaTrader, and TradeStation, and includes robust security measures like DDoS protection, data encryption, and intrusion detection systems to protect sensitive trading data. Professional plans also feature real-time CPU and RAM monitoring tools, helping traders avoid system crashes during sudden market surges. These features work together to ensure that traders maintain a competitive edge, even in the most unpredictable markets.
Conclusion
Energy and defense stocks have proven to be reliable hedges against geopolitical risk during the ongoing Middle East conflict, which began impacting markets on February 28, 2026. While broader indices like the S&P 500 have experienced sell-offs during such crises, these sectors have shown resilience and, in some cases, notable gains. For example, Brent crude prices have climbed nearly 40%, and European TTF gas prices have soared by almost 60%. Meanwhile, defense contractors like Lockheed Martin reached an all-time high of $676.70 in mid-March. Georgina Lu of TradingKey encapsulated this trend:
"In a landscape ruled by uncertainty, [defense and energy] have become the market's few reliable hedges against geopolitical risk".
These movements are not just based on market sentiment but reflect real supply chain disruptions. When transit volumes decline sharply, markets shift from speculative pricing to being driven by actual physical scarcity. Defense stocks, in particular, are benefiting from surging demand for precision-guided munitions and missile systems. This dynamic highlights how physical shortages are now dictating market behavior.
Success in these volatile conditions depends on distinguishing between short-term opportunities and longer-term defensive strategies. For instance, tanker stocks exposed to spot markets can generate quick profits from rising freight rates, while missile-defense suppliers stand to benefit from sustained growth as NATO nations expand defense budgets through 2026. Key chokepoints like the Strait of Hormuz remain critical; disruptions in these areas can quickly shift pricing dynamics from sentiment to scarcity.
The broader economic picture is also shifting. As noted in our analysis of LNG and integrated oil stocks, the narrative has moved from expectations of a "soft landing" to concerns over "energy-led stagflation." Commodity price shocks are now rippling through labor markets and inflation indices. This environment tends to favor U.S.-based energy producers, who are less vulnerable to gas-price shocks than energy-importing industries in Europe and Asia. For traders managing positions across these sectors, maintaining operational efficiency and executing trades quickly is vital. In a volatile market, a matter of milliseconds can determine whether you capitalize on a price spike or miss out entirely.
Staying ahead requires monitoring vessel transits, Flash PMIs, and defense procurement cycles. Whether you're tracking LNG infrastructure plays like Cheniere Energy or observing defense modernization efforts through companies like Northrop Grumman, combining strong market insights with dependable trading tools ensures you're ready to act when volatility strikes and seize emerging opportunities.
FAQs
Why do energy and defense stocks often rise during wars?
During times of war, energy and defense stocks tend to perform well, driven by heightened demand for their offerings. For instance, defense giants like Lockheed Martin often see increased business as governments ramp up spending on military equipment and advanced systems.
At the same time, energy stocks - especially those tied to oil, natural gas, and LNG - typically benefit from surging energy prices. Geopolitical tensions and fears over supply disruptions push these prices higher, making these stocks attractive to investors. Both sectors are often viewed as safe-haven investments during periods of conflict.
Which matters more for these stocks: higher commodity prices or supply disruptions?
Higher commodity prices play a crucial role for these stocks because they thrive on rising oil, natural gas, and energy infrastructure prices. While supply disruptions and geopolitical tensions can intensify these trends, the core factor remains the upward movement in commodity prices.
What are the biggest risks if the conflict de-escalates quickly?
If tensions ease rapidly, one of the main risks would be a steep decline in energy prices. This could hurt energy stocks and industries connected to them. Similarly, reduced defense and military spending could put pressure on defense-related stocks.


