
Hedging with options helps protect your investments from losses by offsetting risks. Whether you're preparing for market volatility or securing gains, strategies like protective puts, covered calls, and collars offer tailored solutions. Here's what you need to know:
- Hedging Basics: It’s like insurance for your portfolio - pay a small cost now to avoid larger losses later.
-
Key Strategies:
- Protective Puts: Set a price floor for your stocks, limiting downside risks.
- Covered Calls: Earn income by selling calls on stocks you own, with limited downside protection.
- Collars: Combine puts and calls to create a defined range of risk and reward.
- The Greeks: Metrics like Delta, Gamma, and Theta help you measure and manage the effectiveness of your hedge.
- Cost Considerations: Hedging typically costs 1%-3% of your position value per quarter, with lower costs when market volatility is subdued.
Using reliable tools, such as low-latency VPS for algorithmic trading, ensures timely execution of these strategies, especially in fast-moving markets. Choose the right approach based on your market outlook and risk tolerance to safeguard your portfolio effectively.
Core Concepts of Option Hedging
Options Hedging Strategies Compared: Protective Put vs Covered Call vs Collar
Before diving into hedging strategies, it’s critical to grasp the fundamentals of options. These concepts act as the foundation for building an effective hedge. Without them, you risk turning what could be a smart protection strategy into a costly misstep.
Options Basics: Calls, Puts, and Key Terms
A call option gives you the right (but not the obligation) to buy an asset at a predetermined price before a specific date. On the other hand, a put option gives you the right to sell an asset at that price. In hedging, puts are more commonly used because they serve as a price floor for assets you already own.
Here are a few essential terms to understand when working with options:
- Strike price: The price at which you can buy or sell the underlying asset.
- Premium: The upfront cost of the option - essentially, the price you pay for protection.
- Expiration date: The date by which you must exercise the option, or it becomes worthless.
- Intrinsic value: The portion of the premium that reflects the option's actual, immediate value (how far "in the money" it is).
- Extrinsic value: The remaining part of the premium, influenced by time left until expiration and implied volatility.
Each standard option contract typically covers 100 shares of the underlying stock. For example, if you’re hedging 500 shares, you’d need five contracts.
Understanding the Greeks in Hedging
The "Greeks" are key metrics that help you understand how different factors impact your option's value. For hedging purposes, three are particularly important.
Delta measures how much the option’s price changes for every $1 move in the underlying stock. For instance, a put option with a delta of -0.65 will increase by about $0.65 for every $1 drop in the stock price. Delta also serves as a hedge ratio, showing how much of your stock exposure the option covers. A low-delta put (e.g., -0.20) offers less protection per dollar spent, which is why at-the-money or in-the-money puts are often preferred for downside protection.
Gamma tracks how quickly delta changes as the stock price moves. Puts have positive gamma, meaning the hedge becomes more effective as the stock price drops further.
Theta represents the cost of holding the option over time. As time passes, the option loses value due to time decay - essentially, this is the daily cost of maintaining your hedge.
These metrics provide a clearer picture of how your hedge will behave under various market conditions, helping you compare strategies before committing.
How Hedging Changes Your Position Risk
By combining these metrics, you can evaluate the trade-offs of different hedging strategies. The goal is to limit potential losses while managing your profit potential. Here’s how common strategies affect risk and reward:
| Scenario | Downside Risk | Upside Potential | Trade-off |
|---|---|---|---|
| Unhedged long stock | Unlimited (down to $0) | Unlimited | No cost, full exposure |
| Protective put | Capped at strike price | Unlimited | Premium reduces net return |
| Covered call | Partial buffer from premium | Capped at strike price | Generates income, but gains are limited |
| Collar | Capped at put strike | Capped at call strike | Low or zero net cost; profit range is fixed |
Run 24/7 while you sleep. Keep bots, platforms, and trade copiers online on a dedicated VPS.
Low-latency VPS hosting for your trading platform.
From $59.99/mo
As the table shows, every hedging strategy involves a trade-off.
"A reduction in risk, therefore, always means a reduction in potential profits. Hedging, for the most part, is thus a technique that is meant to reduce a potential loss (and not maximize a potential gain)." - Investopedia
It’s important to remember that no hedge is perfect. Hedging is about reducing risk, not eliminating it entirely. The ultimate goal is to define your worst-case scenario in advance, so you’re better prepared for unexpected market moves.
Step-by-Step Guide to Common Hedging Strategies
Let’s dive into some practical ways to manage risk using hedging strategies, applying concepts like the Greeks and understanding trade-offs.
How to Implement Protective Puts
A protective put works like insurance for your stock holdings. By purchasing a put option on a stock you already own, you set a minimum price - ensuring you can sell at the strike price even if the stock's value plummets.
"The strike price of the put option acts as a barrier where losses in the underlying stock stop." - Investopedia
Here’s how to get started:
- Check your shares: Make sure you own at least 100 shares for each put contract.
- Choose an expiration date: Pick a timeframe that covers the period of concern, like 30, 60, or 90 days. Protective puts are especially useful for short-term risks, such as earnings reports or major market events.
- Set your strike price: Decide on a strike price based on your risk tolerance. An at-the-money put provides full protection but costs more, while an out-of-the-money put is cheaper but requires you to absorb some initial losses.
- Buy the put and calculate costs: Your break-even point is the stock's purchase price plus the premium you pay. The maximum loss equals (Stock Purchase Price − Put Strike Price) + Premium Paid.
- Reassess at expiration: If the stock falls below the strike, you can exercise the put to sell at the strike price. If the stock rises, let the put expire and consider buying another one for continued protection.
Example: Suppose you own 100 shares of GE bought at $10, which later rises to $20. You purchase a three-month put with a $15 strike at a $0.75 premium (total cost: $75). If GE drops back to $10, you can still sell at $15, securing a net profit of $4.25 per share. If GE climbs to $30, your profit would be $19.25 per share after factoring in the premium.
Protective puts generally cost between 1% and 3% of the stock’s value per quarter, depending on market volatility. To save on costs, consider buying when the VIX (volatility index) is below 15.
How to Use Covered Calls for Income and Partial Protection
Covered calls are a way to earn income while reducing your exposure to modest price declines. By selling a call option on shares you already own, you collect a premium that lowers your cost basis. This strategy is ideal when you have a neutral or slightly bullish outlook.
Here’s how it works:
- Own the stock: Make sure you have 100 shares of the stock for each call option sold.
- Sell a call option: Choose a strike price where you’d be comfortable selling your shares. This can be done as part of a buy-write (buying the stock and selling the call simultaneously) or an overwrite (selling calls on shares you already own).
Example: You buy 100 shares of XYZ at $50 and sell a six-month call with a $55 strike, collecting a $4 per share premium ($400 total). If XYZ rises to $60, your profit is capped at $9 per share ($5 capital gain + $4 premium), or an 18% return. If XYZ falls to $40, the premium offsets part of the loss, reducing it to $6 per share.
The biggest risk with covered calls is assignment. If the stock price exceeds the strike, you may be required to sell your shares at the strike price. To avoid surprises, always set the strike price at a level where you’re okay letting go of the stock.
"A covered call will limit the investor's potential upside profit and may not offer much protection if the stock price drops." - Investopedia
How to Build a Collar Strategy
A collar strategy combines the benefits of protective puts and covered calls, offering both downside protection and income. You hold the stock, buy an out-of-the-money (OTM) put for protection, and sell an OTM call to help cover the cost of the put. This creates a defined range for your stock position, with a protective floor and a capped ceiling.
"The collar strategy is named that because it essentially puts both a 'floor' and 'ceiling' on the stock position, like a collar around the neck." - Investopedia
The goal is often to create a zero-cost collar, where the premium from the sold call offsets the cost of the put. To set it up:
- Pick a put strike: Choose a level that represents the maximum loss you’re willing to accept.
- Select a call strike: Set this at a price where you’d be comfortable selling the stock.
- Match expiration dates: Ensure both options share the same expiration and cover the same number of shares.
Here’s a quick breakdown of outcomes:
| Outcome Metric | Net Credit Setup | Net Debit Setup |
|---|---|---|
| Breakeven Point | Stock Purchase Price − Net Premium Collected | Stock Purchase Price + Net Premium Paid |
| Maximum Profit | (Call Strike − Stock Price) + Net Premium | (Call Strike − Stock Price) − Net Premium |
| Maximum Loss | (Put Strike − Stock Price) + Net Premium | (Put Strike − Stock Price) − Net Premium |
Collars work well for traders who want to protect gains during uncertain times while maintaining a moderately bullish or neutral stance. However, if you’re expecting significant upside, the capped profit potential might not be ideal.
One advantage of collars is their near-zero vega, meaning they’re less affected by changes in implied volatility. The offsetting effects of the long put and short call make this strategy more predictable to manage over time.
Operational Factors to Consider When Hedging
Why Fast Execution Matters in Volatile Markets
When markets are volatile, quick execution isn't just important - it's essential. Options pricing can change in the blink of an eye, and liquidity can disappear just as fast. This can lead to stop-loss orders being triggered at prices far worse than anticipated. For instance, a protective put only acts as a safety net if it's already in place before a market gap occurs.
Complex factors like Vanna and Charm - second-order Greeks - can amplify price swings further. If a hedge adjustment is delayed, losses can escalate quickly. As Marcus Bennett, Senior Risk Management Editor, aptly explains:
"The best hedge is usually not the one with the highest theoretical protection; it is the one you can actually maintain through a drawdown without abandoning the strategy at the worst possible time." - Marcus Bennett
For traders aiming to manage delta-neutral portfolios, executing trades in sub-millisecond timeframes is critical. This highlights the importance of a solid infrastructure - not just for understanding options mechanics but for maintaining the integrity of your hedging strategy.
How QuantVPS Supports Hedging Workflows
Stay online and closer to execution. Choose a VPS location for CME futures, New York markets, London FX, API trading, and more.
Host your platform near the market route that matters.
From $59.99/mo
To address the need for speed and reliability, QuantVPS minimizes risks tied to local system failures by operating in professional datacenter environments. It supports popular trading platforms like NinjaTrader, MetaTrader 4/5, TradeStation, and Sierra Chart. Pre-configured with Windows Server 2022, QuantVPS ensures stability and offers lightning-fast latency to the CME from its Chicago-based datacenters - less than 0.52 milliseconds.
For traders managing complex setups, such as collars or delta-neutral portfolios, higher-tier QuantVPS plans allow up to six monitors via RDP. This enables seamless tracking of Greeks, volatility data, and order flow simultaneously.
Additionally, the infrastructure includes features like automatic reconnection logic and kill switches. These safeguards halt order routing if data feeds experience even slight delays, ensuring automated hedging systems remain reliable.
Picking the Right QuantVPS Plan for Your Trading Setup
Choosing the right VPS plan is crucial for maintaining control during high-volatility sessions. Here's a breakdown of QuantVPS plans:
| Plan | Monthly Price | Best For | Key Specs |
|---|---|---|---|
| VPS Lite | From $59.99 | 1–2 simple strategies | 4 Cores, 8GB RAM, 1 Monitor |
| VPS Pro | From $99.99 | 3–5 strategies | 6 Cores, 16GB RAM, 2 Monitors |
| VPS Ultra | From $189.99 | 5–7 strategies | 24 Cores, 64GB RAM, 4 Monitors |
| Dedicated | From $299.99 | 7+ strategies / heavy backtesting | 16+ Cores, 128GB RAM, 6 Monitors |
For straightforward strategies like a single covered call or protective put, the Lite plan is a cost-effective choice. If you're juggling multiple collars and need to monitor real-time Greeks, the Pro or Ultra plans provide the necessary performance. On the other hand, high-frequency delta-neutral strategies or intensive backtesting demand the resources of the Dedicated plan.
Opting for annual billing can significantly reduce costs. For example, the Lite plan drops to $41.99 per month, and the Dedicated plan to $209.99 per month. This makes it easier to justify infrastructure expenses when weighed against the capital you're safeguarding.
Choosing the Right Hedging Strategy for Your Risk Profile
Matching Your Strategy to Your Risk Tolerance and Market View
When selecting a hedging strategy, it's crucial to align it with both your risk tolerance and market outlook. Each strategy serves a specific purpose, so understanding your objectives is the first step. For example:
- A protective put is ideal for those who prioritize downside protection and want unlimited upside potential. However, this approach comes with the highest cost.
- A covered call works well in stable or slightly bullish markets, offering income generation with limited downside protection.
- If you're looking to balance downside protection with cost control, a collar may be the way to go. This strategy offsets the cost of a protective put by selling a call.
Your choice should reflect not only your market expectations but also your risk appetite. For instance, collars are particularly effective for locking in gains on stocks that have already rallied, especially when you want to avoid triggering capital gains taxes. On the other hand, covered calls may underperform in strong bull markets if your stock gets called away prematurely.
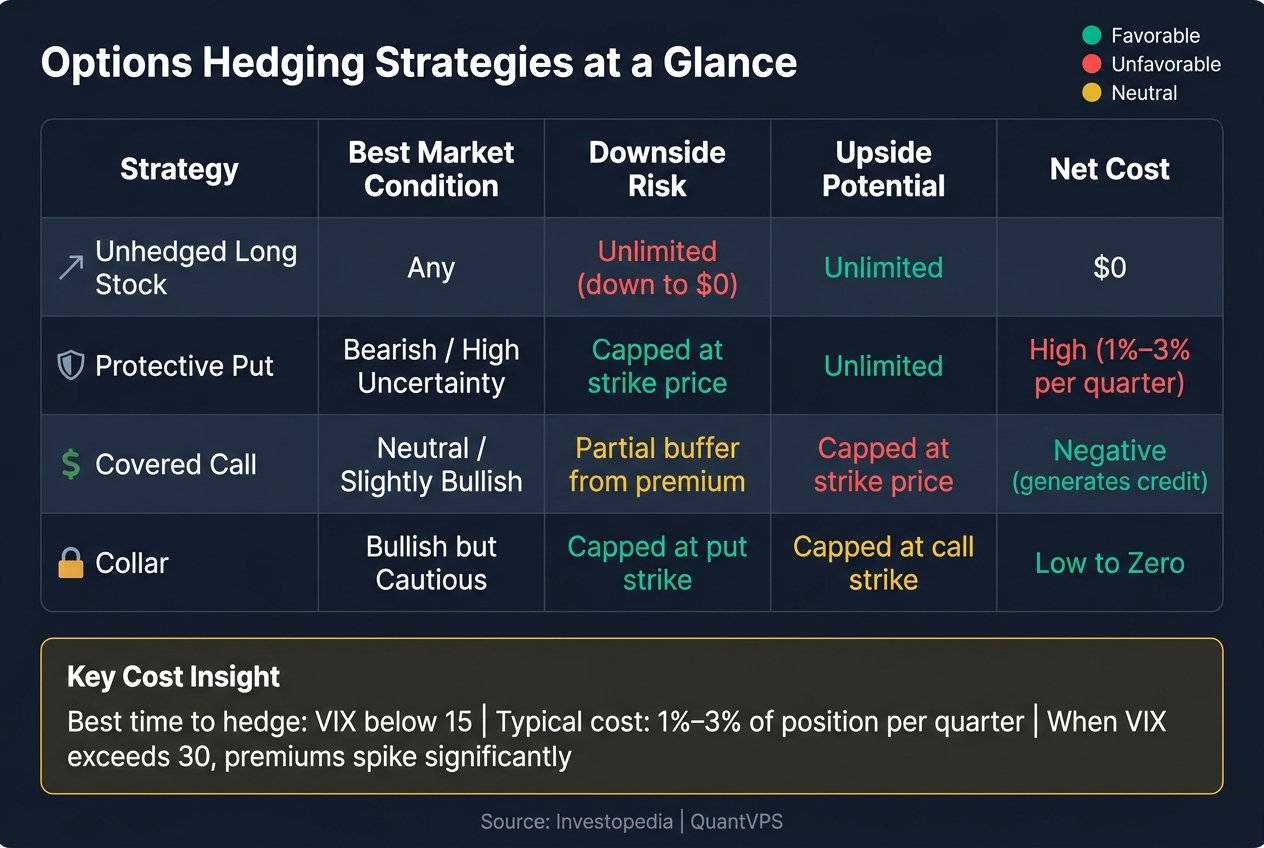
| Strategy | Best Market Condition | Risk Profile Fit | Net Cost |
|---|---|---|---|
| Protective Put | Bearish / High uncertainty | Maximum downside protection needed | High |
| Covered Call | Neutral / Slightly bullish | Income-focused, limited protection needed | Negative (credit) |
| Collar | Bullish but cautious | Balanced protection with cost control | Low to zero |
Once you've matched your strategy to your profile, the next step is to evaluate the financial impact of implementing these hedges.
How to Measure the Cost of Hedging
The direct cost of a hedge is the premium you pay, but don't overlook additional factors like the bid-ask spread and commissions. Thinly traded options with wide bid-ask spreads can quietly chip away at your protection.
Typically, options-based hedges such as protective puts cost between 1% and 3% of the position value per quarter. Here's a practical example:
- Position: 100 shares of AAPL, April 2024 (~$17,655 value)
- Put: June 2024 $170 put at $4.50
- Call sold: June 2024 $185 call at $3.65
- Net cost: $85 (~0.48% of position value)
- Protected range: $17,000 floor, $18,500 ceiling
Timing plays a significant role in hedging costs. The most affordable time to buy protection is when the VIX (Volatility Index) is below 15. When the VIX spikes above 30, premiums can become prohibitively expensive - right when many traders feel the most urgency to hedge.
Using Analytics to Test Hedging Strategies
Once you've calculated the costs, it's time to test your strategy's effectiveness using analytics. Platforms like NinjaTrader and TradeStation, which are supported by QuantVPS, offer tools to backtest trading strategies and perform scenario analysis. These tools let you simulate historical price movements to evaluate how strategies like collars or protective puts would have performed during past market downturns.
One useful metric is the cost per market day across different expiration dates. Longer-dated options, such as LEAPS, often provide a lower monthly cost of protection compared to frequently rolling short-term options. Running these analyses on a stable, low-latency environment ensures that your simulations reflect realistic execution conditions, rather than overly optimistic fills. This step is key to building a solid, real-world hedging plan.
Conclusion: Key Takeaways for Effective Option Hedging
Hedging effectively starts with understanding your risk tolerance, selecting the right strategy, managing costs, and executing with precision. For instance, a protective put acts as a safety net, limiting losses while allowing for unlimited upside, though it comes with a high premium. A covered call, on the other hand, works well in flat or slightly bullish markets by generating income but limits potential gains. A collar strikes a balance between protection and cost, often achieving this at little to no net premium, making it an efficient way to lock in profits.
Once you’ve chosen a strategy, knowing its financial implications is essential. Keeping costs under control is critical - frequently rolling short-term options can quickly erode your account. Timing is equally important; hedging when implied volatility is low is far more cost-effective than rushing to buy protection after volatility spikes. This approach not only keeps premiums manageable but also ensures the sustainability of your strategy.
"Market makers, hedge funds, and other professional traders know that hedging is not only one of the strongest characteristics of option trading, but also the key to profitable long-term trading." - IVolatility.com
Execution matters just as much as strategy. Using limit orders tied to the stock’s price - rather than market orders - can prevent costly errors, especially in fast-moving markets where bid-ask spreads can widen significantly. Maintaining a hedged position often outperforms moving entirely to cash during periods of volatility, highlighting the importance of proper execution and a well-thought-out approach.
To bring these strategies to life, reliable trading technology is non-negotiable. Tools that enable real-time monitoring of the Greeks, timely adjustments, and thorough backtesting are essential. A stable, low-latency setup - like running your trading platforms on QuantVPS - ensures your hedges operate as planned in live markets, minimizing downtime and execution delays. This infrastructure is a cornerstone of effective hedging, allowing your strategies to perform as intended in real-world conditions.
FAQs
How many option contracts do I need to hedge my shares?
The number of option contracts you'll need depends on your stock holdings and the details of the options themselves. In the U.S., a single standard options contract usually represents 100 shares. So, if you own 200 shares, you'd require 2 contracts to fully hedge your position. Be sure to adjust this based on your personal risk tolerance, trading strategy (like using protective puts), and the current market environment.
Which matters more for a hedge: delta or time decay (theta)?
When it comes to hedging, delta takes center stage over time decay (theta). Why? Because delta measures how sensitive an option is to changes in the price of the underlying asset. This makes it a critical tool for managing directional risk and ensuring your hedge remains effective as market conditions shift.
Theta, on the other hand, reflects the impact of time decay on an option's value. While it's important for strategies that capitalize on the passage of time, theta usually takes a backseat in hedging. The primary focus in hedging is adjusting exposure and reducing market risk, which is where delta management truly shines.
Should I hedge before or after volatility spikes?
Hedging before a volatility spike is a smart move. It gives traders a chance to lock in protective positions while the market is relatively calm. This way, they can avoid the higher options premiums and added costs that come with market turbulence. If you wait for volatility to spike, hedging becomes less reliable because of sudden price swings and fewer options available. Taking a proactive approach helps maintain better risk control and ensures steadier protection during unpredictable times.


