
Order Blocks (OBs) are key price zones on charts that reveal where institutional traders, like banks and hedge funds, have executed large buy or sell orders. These zones often signal potential market reversals or continuations. By identifying OBs, you gain insights into institutional activity, which drives most of the market's volume.
Key Takeaways:
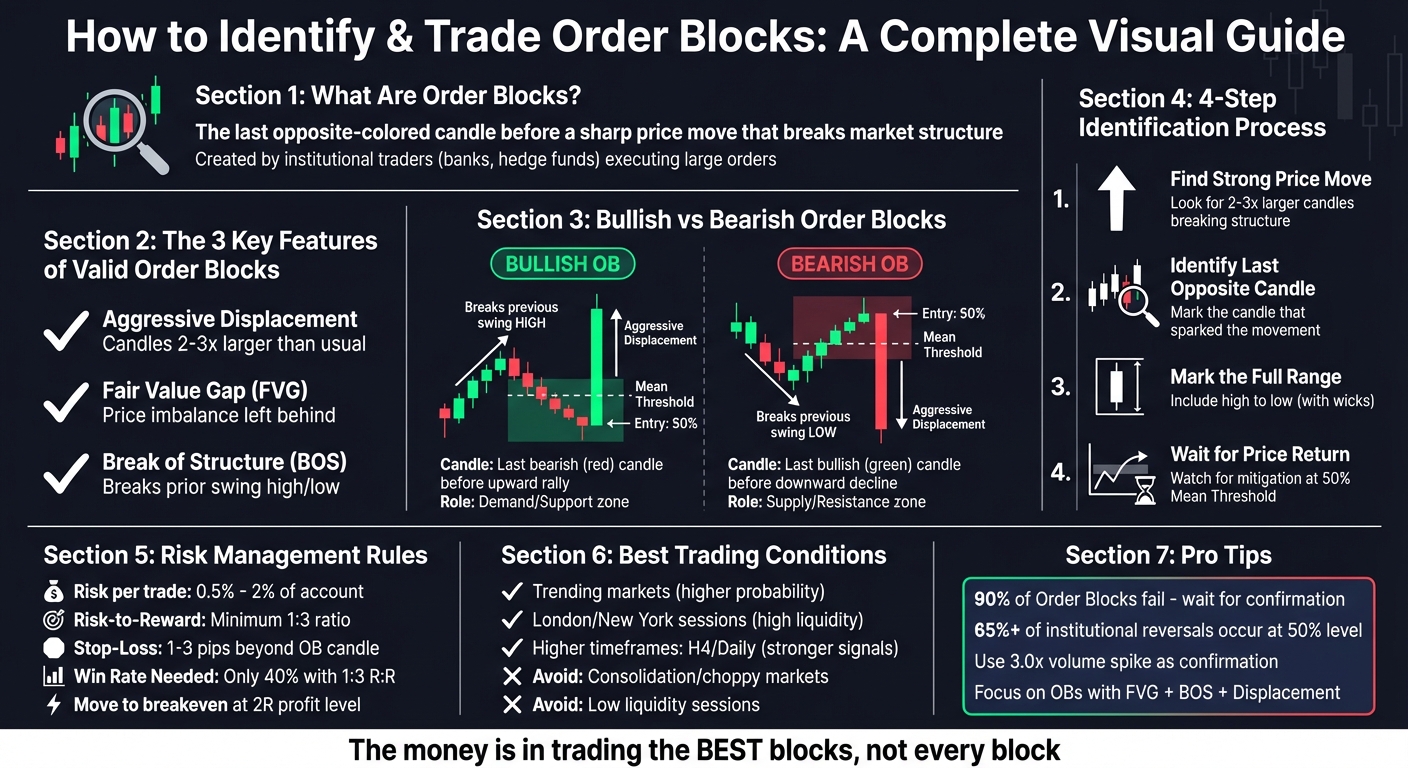
- What Are OBs?: The last opposite-colored candle before a sharp price move that breaks market structure.
- Why They Matter: They represent institutional trading zones, often leading to significant price reactions.
-
How to Identify OBs:
- Look for aggressive price displacement.
- Confirm with a Break of Structure (BOS).
- Spot Fair Value Gaps (FVGs) left behind.
- Entry Points: Use the "Mean Threshold" (50% of the OB candle) for precise entries.
- Timeframes: Higher timeframes (H4/Daily) reveal stronger OBs, while lower timeframes help refine entries.
- Risk Management: Keep stop-loss tight (1–3 pips beyond the OB) and aim for a 1:3 risk-to-reward ratio.
Quick Example:
If EUR/USD forms a bearish OB on the H4 chart, wait for price to revisit the zone. Look for confirmation on lower timeframes (e.g., M15) before entering a short trade.
Order Blocks work across forex, stocks, and even crypto, but their reliability depends on market conditions. Trending markets and high-liquidity sessions (London/New York) increase their effectiveness. Use OBs alongside other tools like liquidity sweeps and BOS for better accuracy.
Pro Tip: Focus on high-quality OB setups with clear displacement, structural breaks, and FVGs to improve your win rate.
Step-by-Step Guide to Identifying and Trading Order Blocks
What Are Order Blocks and Why Do They Matter?
An Order Block (OB) represents a specific price zone on a chart - typically, the last candle of the opposite color before a sharp price movement that disrupts the market structure. These zones are created by major institutions, like central banks or tier-1 hedge funds, when they execute large-scale buy or sell orders. Since these institutions manage positions worth hundreds of millions of dollars, they tend to cluster their orders within a tight price range, leaving behind what traders call liquidity zones.
These liquidity zones serve as key areas where institutions either accumulate or exit their orders. When the price revisits an Order Block, it’s not just bouncing off a random level of support or resistance. Instead, it’s often a return to an area where institutions may still have unfinished business, like closing positions or triggering additional orders. This is why these zones frequently lead to market reversals.
However, not every opposite-colored candle qualifies as an Order Block. To confirm an OB, the price must show a strong displacement - a decisive move away from the zone - and also break the market structure. This concept is essential for understanding how institutional activity leaves a visible impact on the market.
Here’s a quick comparison of bullish and bearish Order Blocks:
| Feature | Bullish Order Block | Bearish Order Block |
|---|---|---|
| Candle Type | Last bearish candle before an upward rally | Last bullish candle before a downward decline |
| Market Role | Acts as a demand/support zone | Acts as a supply/resistance zone |
| Validation | Requires breaking a previous swing high | Requires breaking a previous swing low |
| Precision Entry | 50% of the candle body (Mean Threshold) | 50% of the candle body (Mean Threshold) |
How Institutional Traders Leave Their Mark
Institutional orders create noticeable patterns on price charts, often seen in concentrated and decisive price movements.
"An Order Block trading strategy is not about candlestick patterns; it is about identifying where a massive institutional 'buy' or 'sell' program was initiated."
- Alex "Vanguard" Thorne, Senior Forex Strategist
For example, in November 2025, the EUR/USD pair formed a bearish 4-hour Order Block at 1.0950. At the time, 70% of retail traders were long on the pair. Price briefly spiked 5 pips above the Order Block, triggering retail buy stops, before plunging 120 pips within three hours. This drop coincided with the Dollar Index (DXY) forming a bullish Order Block. While retail traders saw this as a "triple bottom" support level, institutions viewed it as a liquidity area that needed to be cleared before the real Order Block came into play.
By recognizing these institutional footprints, traders can refine their technical analysis and better understand where significant money is positioned. Higher timeframe Order Blocks, such as those on the Daily or 4-hour charts, are particularly useful because they filter out market noise and tend to provide more reliable signals. Additionally, high-probability Order Blocks are often accompanied by a Fair Value Gap - an imbalance in price that acts like a magnet, pulling the price back for rebalancing.
Run 24/7 while you sleep. Keep bots, platforms, and trade copiers online on a dedicated VPS.
Low-latency VPS hosting for your trading platform.
From $59.99/mo
Order Blocks vs. Block Orders: Key Differences
It’s important to distinguish between these two terms. A block order refers to an actual, large-scale transaction - typically $100 million or more - executed by institutional traders. On the other hand, an Order Block is the price zone or chart footprint that indicates where such transactions took place.
How to Spot Bullish and Bearish Order Blocks
To identify Order Blocks, focus on the last opposite-colored candle before a significant price movement. This candle often signals where institutions placed large orders, making it a critical marker for traders.
A valid Order Block has three key features: aggressive displacement, a Fair Value Gap (FVG), and a Break of Structure (BOS). Displacement refers to a sharp move, often with candles 2–3 times larger than usual. The FVG is the price imbalance or "void" left behind during this movement. Finally, the move must break a prior swing high (bullish) or swing low (bearish), confirming the structural change in the market.
"Order blocks are not standalone signals. They live inside a broader narrative of trend, liquidity, and inefficiency."
- ACY Securities Editorial Team
With this framework in mind, let’s dive into how these principles apply to bullish and bearish setups.
Bullish Order Blocks
To spot a bullish Order Block, look for the last bearish (down) candle before a sharp upward price movement that breaks market structure. This area often represents a demand zone where institutions have placed buy orders. The block remains valid until the price revisits and interacts with it, either by touching or closing within the zone.
A popular entry point for bullish Order Blocks is the Mean Threshold, or the 50% mark of the candle's range. Reports suggest over 65% of institutional reversals occur at this level. For a more cautious approach, consider entering at the top of the candle's body. High bullish volume during the block's formation can further validate institutional involvement.
However, be wary of bullish Order Blocks located just below equal lows. These areas often act as liquidity pools, where institutions may sweep stops before initiating the reversal.
Bearish Order Blocks
A bearish Order Block is identified as the last bullish (up) candle before a strong downward price movement. This zone serves as a supply area, indicating where institutions have initiated sell programs. When the price revisits this level, it typically encounters renewed selling pressure.
As with bullish setups, the 50% level of the candle is often a key re-entry point for institutions. For short positions, you can also consider entering at the bottom of the candle's body.
Exercise caution with bearish Order Blocks near equal highs. These zones are often traps where institutions sweep retail buy stops before the actual downward move begins. Waiting for this liquidity sweep to complete can help you avoid falling victim to a stop hunt.
Step-by-Step Methods for Finding Order Blocks
The Identification Process
To find an Order Block, start by identifying a strong price move that breaks the previous market structure. Look for candles that are noticeably larger - about 2–3 times the average size on your chart. Then, focus on the last opposing candle that sparked this movement. For a bullish Order Block, this would be the final bearish candle before the price surged upward. For a bearish Order Block, it’s the last bullish candle before the price dropped significantly.
Mark the full range of this candle, from its high to its low (including the wicks), to define your Order Block zone. The next step is to observe what happens when the price returns to this zone. An Order Block is considered "mitigated" when the price revisits the area and absorbs the remaining institutional orders. A key reference point here is the "Mean Threshold", which is the 50% midpoint of the Order Block candle. This midpoint often highlights critical institutional activity.
Combining Order Blocks with Market Structure
Once you've marked your Order Block, integrate it into the bigger picture of the market structure. Order Blocks gain more importance when they align with structural shifts in the market. A valid Order Block should coincide with a Break of Structure (BOS) - a clear violation of a previous swing high or low, signaling institutional involvement.
Additionally, keep an eye out for Fair Value Gaps (FVG) that often form after an Order Block is created. These gaps represent price imbalances and tend to draw the price back toward the Order Block. Liquidity sweeps are another important element to watch. Institutions frequently target "equal highs" or "equal lows" to trigger stop-loss orders before the market makes its true move.
Choosing the Right Timeframe
After identifying and contextualizing your Order Block within the market structure, selecting the right timeframe can fine-tune your trading strategy. Higher timeframes, such as the Daily or H4 charts, offer a clearer picture of the overall market trend and key institutional levels. Once you’ve pinpointed a higher-timeframe Order Block, you can shift to lower timeframes - like M15, M5, or even M1 - to refine your entry point.
This approach can significantly enhance your risk-to-reward ratio. For example, an H4 Order Block might cover a range of 50 pips. By zooming in on an M15 chart, you could narrow your entry zone to just 10–15 pips, enabling a tighter stop-loss while keeping the same profit target.
Trading Strategies Based on Order Blocks
How to Enter Trades Using Order Blocks
An effective way to enter trades using order blocks is by following a top-down approach. Start by identifying a Point of Interest (POI) on a higher timeframe, such as the H4 or Daily chart. Then, zoom in to a lower timeframe like M15, M5, or even M1 to refine the zone for a more precise entry.
When it comes to execution, traders often rely on two key entry points. The first is the proximal open, which is the initial price level of the candle. This ensures your order gets filled. The second is the Mean Threshold, or the 50% midpoint of the candle body. This level often provides a better risk-to-reward ratio.
Patience is key. Wait for the price to revisit the zone to take advantage of any remaining institutional orders. For confirmation, shift to a lower timeframe and look for patterns like a Change of Character (CHoCH) or a Market Structure Break (MSB) as the price retraces into the higher-timeframe Order Block. Signs of a valid entry zone include:
- A strong, sharp move away from the zone (known as "displacement").
- The formation of a Fair Value Gap (FVG).
- A clear break in prior market structure.
Keep in mind that the most reliable reactions often occur during the London and New York sessions, when market liquidity is at its highest.
Once you've entered a trade, the next step is to ensure your risk management plan is solid.
Managing Risk with Order Blocks
Stay online and closer to execution. Choose a VPS location for CME futures, New York markets, London FX, API trading, and more.
Host your platform near the market route that matters.
From $59.99/mo
After establishing your entry, managing risk becomes a top priority. For a bullish trade, set your stop-loss 1–3 pips below the candle's low. For a bearish trade, place it 1–3 pips above the high. If the price breaks through the block, exit the trade immediately.
Stick to risking no more than 0.5% to 2% of your account balance on any single Order Block setup. Here's why: backtesting shows that traders using a 1:3 risk-to-reward ratio with a 40% win rate perform better than those with a 1:1 ratio, even if they win 60% of the time.
When your trade reaches a profit level equal to twice your initial risk (a 2R level), move your stop-loss to breakeven to protect your capital. Additionally, consider scaling out - close 50% to 80% of your position at the first "trouble area", such as an opposing liquidity pool or Fair Value Gap, and let the rest of your position run toward your final target.
Setting Profit Targets and Exit Points
With your entry and risk parameters in place, the next step is to define clear profit targets. A good rule of thumb is to aim for the next valid Order Block in the opposite direction. For instance, if you entered on a bullish Order Block, look for the nearest bearish Order Block above as your exit zone. To fine-tune this approach, you can target the 50% level of that opposing block.
Fair Value Gaps (FVGs) are another popular exit point since they often act as price magnets. In cryptocurrency markets, for example, FVGs created after major news events are filled approximately 70% of the time. Liquidity pools - areas where stop-losses are concentrated near recent swing highs or lows - also make strategic exit points.
Pay attention to volume as the price nears your target. A sudden increase in volume often signals it's time to exit. Avoid relying solely on arbitrary percentage-based targets. Instead, base your exit strategy on actual market structure and institutional activity for more consistent results.
Order Blocks in Different Markets and Conditions
This section delves into how Order Blocks behave across various markets and under different market conditions, building on earlier insights about institutional trading patterns.
How Order Blocks Work Across Asset Classes
Order Blocks are a versatile concept that applies to a range of asset classes, though the institutional dynamics behind them vary significantly.
In forex, central banks and tier-1 hedge funds dominate the landscape. This means traders need to account for broader macroeconomic factors. For instance, monitoring the Dollar Index (DXY) can provide critical clues about USD pair movements.
In equities and indices, Order Blocks are particularly effective in high-volume assets like the S&P 500. They resemble traditional supply and demand zones but are specifically identified as the last opposite-colored candle before a structural break. Institutional players in these markets often build positions over extended periods, making higher-timeframe blocks (like H4 or Daily) more dependable.
In cryptocurrency, the most reliable Order Blocks are found in major assets like Bitcoin and Ethereum, where institutional activity leaves clearer traces. However, the extreme volatility in crypto markets means displacement moves are often more pronounced. Traders should validate these blocks by looking for sharp price moves, Fair Value Gaps, and distinct structural breaks.
Recognizing these differences across asset classes is key to understanding how varying market conditions can influence the effectiveness of Order Blocks.
Market Conditions That Affect Order Block Reliability
The reliability of Order Blocks is heavily influenced by market conditions.
In trending markets, Order Blocks often form at the origin of the trend and serve as high-probability entry zones during retracements. Institutions frequently use these levels to add to their positions, which makes them particularly reliable when there is a clear directional bias.
Consolidation phases, on the other hand, pose challenges. During rangebound markets, institutions often accumulate positions on higher timeframes. In these conditions, lower-timeframe Order Blocks tend to fail due to insufficient momentum for clean price reactions. Trading Order Blocks in such choppy markets is risky, as these levels are often swept for liquidity without meaningful follow-through.
Timing also plays a critical role. In forex, the most reliable reactions occur during the London and New York sessions when liquidity is at its peak. Conversely, trading during low-liquidity periods, such as session overlaps or transitions, can lead to wider spreads and unpredictable price movements, complicating the identification of valid Order Blocks.
The table below provides a quick overview of how different conditions impact the performance of Order Blocks:
| Condition | Effect on Reliability | Reason |
|---|---|---|
| Trending Market | Enhances | Strong institutional momentum |
| Consolidation/Choppy | Reduces | Levels are often ignored or swept for liquidity |
| Presence of FVG | Enhances | Confirms aggressive institutional displacement |
| Low Volatility | Reduces | Indicates retail-driven activity, not institutional intent |
| London/NY Sessions | Enhances | Higher volume and institutional participation |
| Equal Highs/Lows Nearby | Reduces | Often acts as a trap for retail stop orders |
Using Order Blocks to Improve Your Trading
Once you've identified Order Blocks (OBs), the next step is incorporating them into a solid trading strategy. But let’s be clear - OBs alone won’t guarantee success. What separates effective traders is their ability to pair OBs with other factors like Fair Value Gaps, liquidity sweeps, and Break of Structure confirmations. Together, these elements create setups with a higher chance of success.
A helpful approach is the "Three-Strike" Rule: focus only on OBs that meet three criteria - clear Displacement (a strong, aggressive price move away from the block), a Fair Value Gap left behind, and a confirmed Break of Structure. This straightforward checklist can help you filter out weaker setups. Another critical factor is volume. Look for a 3.0x spike in average volume during the formation of the block, as this often signals institutional activity.
Your timeframe selection is crucial for success. Start by determining the overall market direction on higher timeframes like H4 or Daily. Then, refine your entries on lower timeframes such as M15 or M5. This top-down approach keeps you aligned with the broader trend while allowing for precise entries and tighter stop-losses. Interestingly, data shows that traders using a 1:3 Risk-to-Reward ratio with just a 40% win rate often outperform those with a higher win rate but only a 1:1 risk-to-reward ratio. With this in mind, watch how price reacts in real time to fine-tune your setups.
Practice makes all the difference. Start by observing live price behavior around OBs before committing to trades. Focus on sessions with higher liquidity, like London and New York, and compare these to quieter periods. This will help you distinguish genuine institutional moves from retail traps. As you practice, always prioritize disciplined risk management - it’s the backbone of long-term success.
"The money is not in trading every block. The money is in trading the best blocks."
- Abir Pathak, Trading Systems Strategist
It’s worth noting that nearly 90% of identified Order Blocks fail because they often serve as liquidity pools that institutions target before making the real move. This underscores the importance of waiting for confirmation, sticking to strict risk limits (no more than 2% per trade), and focusing on high-quality setups. With the right combination of careful analysis and disciplined execution, Order Blocks can become a valuable tool in your trading arsenal.
FAQs
How do I confirm an order block is valid and not just a random candle?
To identify a valid order block, start by spotting a period of consolidation followed by a strong, impulsive price movement. This pattern often hints at institutional activity. Next, focus on the last opposing candle before the price surge or drop - this is typically where large orders were placed. Lastly, confirm its validity by watching how the price behaves when it revisits the zone. If you notice sharp bounces or rejections, it’s a strong sign of significant buy or sell orders, solidifying the zone as a legitimate order block.
What’s the difference between an order block and a supply/demand zone?
Order blocks refer to specific price areas where institutional traders place large buy or sell orders. These zones are often recognized by a period of price consolidation followed by a sharp movement. In contrast, supply and demand zones are broader regions that highlight areas where significant market reactions occurred, typically due to institutional activity. While supply and demand zones provide a general picture of market imbalances, order blocks offer a more precise way to identify key entry or exit points.
How can I avoid getting trapped by liquidity sweeps around equal highs/lows?
To steer clear of liquidity sweep traps around equal highs or lows, concentrate on pinpointing true order blocks (OBs) and wait for clear confirmation signals. These could include rejection candles or evidence from order flow. Stick to higher timeframes to identify more reliable OBs, and resist the urge to jump into trades right after a sweep. Instead, watch for signs that the price is respecting the OB - such as a rejection or a return for mitigation - to confirm the move is legitimate.


