Opening checkout
Rated 4.9 out of 5 Trusted by 20,000+ traders $10B+* traded weekly

65,708

PassMark CPU Mark

Dedicated+ · highest reference score

VPS performance, measured.

PassMark CPU Mark and single-thread reference scores for every plan, AMD Ryzen and EPYC side by side.

  • Every plan scored
  • Ryzen 85% faster single-thread
  • PassMark's published results

Dedicated+ 65,708 CPU Mark · 4,728 single-thread · AMD Ryzen 9 9950X. Dedicated: 45,247 · AMD Ryzen 9 5950X.

Higher is better. Logarithmic scale from 1,000 to 65,708. Heights are not proportional to scores.

Reference scores, not a live test. Source and notes

Trading VPS benchmarks: every plan, every specification, side by side.

Compare reference CPU scores with the cores, memory, and NVMe storage allocated to each plan. All tiers are shown below, from your first chart to a dedicated trading server.
PassMark reference boardData through 2026-10-05

Single-thread: one core’s speed

What a live platform feels.

Single-threadPer tier · higher is faster

Standard VPSAMD EPYC 7003
2,554
Performance VPSAMD Ryzen 9 9950X
4,728
DedicatedAMD Ryzen 9 5950X
3,477
Dedicated+AMD Ryzen 9 9950X
4,728

CPU Mark: the largest plan of each tier

What backtests and optimization use.

CPU MarkLargest plan · linear scale

Standard VPSVPS Ultra · 12 vCPUs
15,185
Performance VPSVPS Ultra+ · 8 cores
28,100
DedicatedBare metal · 12+ cores
45,247
Dedicated+Bare metal · 12+ cores
65,708

Open a tier, then scroll across its table to see all specifications.

Standard VPS

AMD EPYC · DDR4 ECC · NVMe

4 plans
Standard VPS: allocated hardware, PassMark CPU Mark and single-thread references, and workload guidance.
PlanPassMark CPU MarkSingle-threadCPU coresMemoryNVMe storageWorkload guidance
VPS Starter
2,550
2,5542x4GB DDR450GB NVMe

0–1 charts/strategies

1 prop account

VPS Lite
5,092
2,5544x8GB DDR475GB NVMe

1–3 charts/strategies

1–2 prop accounts

VPS Pro
8,020
2,5546x16GB DDR4150GB NVMe

3–5 charts/strategies

3–5 prop accounts

VPS Ultra
15,185
2,55412x32GB DDR4300GB NVMe

5–10 charts/strategies

5–10 prop accounts

Performance VPS

AMD Ryzen · DDR5 ECC · NVMe

4 plans
Performance VPS: allocated hardware, PassMark CPU Mark and single-thread references, and workload guidance.
PlanPassMark CPU MarkSingle-threadCPU coresMemoryNVMe storageWorkload guidance
VPS Starter+
8,100
4,7282x4GB DDR550GB NVMe

0–1 charts/strategies

1 prop account

VPS Lite+
15,600
4,7284x8GB DDR575GB NVMe

1–3 charts/strategies

1–2 prop accounts

VPS Pro+
22,200
4,7286x16GB DDR5150GB NVMe

3–5 charts/strategies

3–5 prop accounts

VPS Ultra+
28,100
4,7288x32GB DDR5300GB NVMe

5–10 charts/strategies

5–10 prop accounts

Dedicated servers

AMD Ryzen · Bare metal · Entire machine

2 plans
Dedicated servers: allocated hardware, PassMark CPU Mark and single-thread references, and workload guidance.
PlanPassMark CPU MarkSingle-threadCPU coresMemoryNVMe storageWorkload guidance
Dedicated
45,247
3,47712x+128GB DDR41TB NVMe

10+ charts/strategies

20+ prop accounts

Dedicated+
65,708
4,72812x+128GB DDR52TB+ NVMe

10+ charts/strategies

20+ prop accounts

Reference scores derived from PassMark's published CPU Mark for the installed processor (cpubenchmark.net, data through 2026-10-05), scaled to each plan's vCPU allocation. Dedicated servers show the bare-metal average. Not a live test of this VPS.

Dedicated+ scores are for the Ryzen 9 9950X (65,708 CPU Mark, 4,728 single-thread). Some Dedicated+ servers run the Ryzen 9 9900X: 54,290 CPU Mark, 4,670 single-thread.

CPU Mark measures processing performance. Higher is faster; the table meters use the same logarithmic scale from 1,000 to 65,708. Bar lengths are not proportional to scores. The reference board above uses linear scales. Chart, strategy, and prop account counts are sizing guidance; indicators and data feeds affect capacity. Your selected configuration determines the resources you receive.

How we size these plans
View pricing and availability

What a PassMark score tells you, and what it does not.

CPU Mark measures overall processing performance. Use the reference scores alongside the allocated cores and memory to compare plans for backtests, optimization, and other compute-heavy work.

CPU Mark: the whole allocation

What backtests use

VPS Pro+: 6 reserved cores × 3,700 per core = 22,200 CPU Mark.

6 reserved cores × 3,700 per core. Ultra+: 28,100; Dedicated+: 65,708.

  1. Single-thread vs CPU Mark: the number for a live platform, and the number for backtests.

    Live charts and indicators run mostly on one core; backtests use the whole allocation. Performance VPS on Ryzen is 85% faster than Standard VPS on EPYC, one core against one core.

  2. Reference scores, matched to the plan: PassMark results for the installed CPU, scaled to your allocation.

    PassMark’s published results (cpubenchmark.net, data through 2026-10-05) for the processor your plan runs on. Dedicated servers carry the bare-metal figure.

  3. Benchmarks measure the machine. Latency measures the route: 0.52ms to CME from Chicago.

    Exchange latency depends on the datacenter, broker and gateway route, not the CPU. Compare locations and the CME route.

Which plan for your setup: one platform, a multi-chart desk, or backtests and optimization.

The right plan depends on what you run together. Use these starting points, then compare the resources and scores above.
Illustrative workspace1–3 charts

Your daily trading workspace.

A focused setup for live charts, indicators, and a single platform that stays online.

  • 1–3 charts or strategies
  • Memory for your platform and data feed

A starting point

VPS Lite or Lite+

Charts or strategies
1–3
Prop-firm accounts
1–2
Monitors
1
Backtesting
No backtesting

CPU MarkLinear · 0–50,000

VPS LiteEPYC 7003
5,092
VPS Lite+Ryzen 9 9950X
15,600

Chart counts are a guide, not a limit. Indicator complexity, tick data, and simultaneous strategies change how much capacity you need.

Find my plan

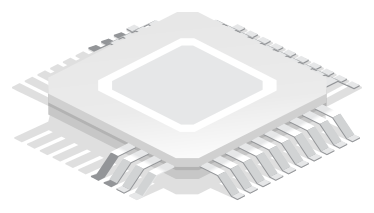
The silicon behind the score: latest-generation AMD Ryzen, DDR5 ECC and NVMe.

Ryzen processors, DDR5 ECC memory, and NVMe storage work together in our Performance tiers. Standard VPS plans use AMD EPYC and DDR4 ECC; the comparison above shows each plan’s allocation.

Compute

AMD Ryzen 9 9950X

16 cores, up to 5.7 GHz boost

High-frequency Ryzen processors power the Performance tiers. Single-thread speed helps with the chart rendering and indicator calculations that live platforms rely on.

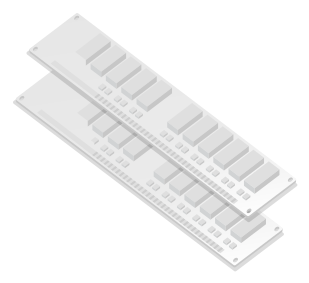
Memory

DDR5 ECC memory

Reserved per VPS, error-correcting

Reserved memory gives your charts and strategies room to run. ECC detects and corrects single-bit memory errors during long-running sessions.

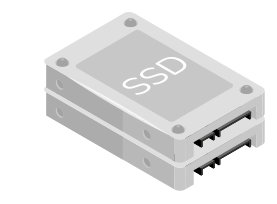
Storage

Enterprise NVMe

Up to 7,000 MB/s sequential read

Fast storage helps platforms load historical data and record incoming ticks. More demanding backtests benefit from keeping that data close to the processor.

Trading VPS benchmark FAQ.

Sound familiar?5 common ones

Ever missed a setup because you were away from your desk?

Market data keeps flowing and your strategies keep running.

If any of these sound familiar, a trading VPS is the fix.

For a responsive live platform, prioritize single-thread performance; Performance-tier plans score about 4,728 single-thread, 85% higher than the Standard tier. Total score matters most for backtesting, and our reference scores are shown above.

No overselling: the cores you pay for are reserved for your workload at the market open as well as at 3am. Reference scores describe the allocation; your applications still determine actual performance.

No. Benchmarks measure the machine; latency measures the route. QuantVPS pairs reference PassMark scores per tier with exchange-adjacent datacenters, including 0.52ms to CME from Chicago. Compare network routes.

No. These are reference scores derived from PassMark’s published CPU results, scaled to the plan’s allocation. Dedicated servers show the bare-metal average.

Dedicated+ has a 4,728 single-thread reference score. Performance VPS tiers score 4,728.
See all FAQAnswers on servers, latency, access, security and support.