
Keltner Channels are a trading tool that combines trend direction with market volatility. They consist of three lines: a central Exponential Moving Average (EMA) and two outer bands calculated using the Average True Range (ATR). These bands dynamically adjust to market conditions, expanding during high volatility and contracting during calmer periods. Traders use Keltner Channels to identify trends, breakouts, and pullbacks, offering a structured way to analyze price movements.
Key takeaways:
- Trend Analysis: Prices near the upper band suggest bullish momentum, while those near the lower band indicate bearish trends.
- Volatility Insights: The channel width reflects market volatility - narrow bands often precede big moves, while wide bands indicate heightened activity.
- Trading Strategies: Breakout trades occur when prices close outside the bands, while pullback trades use the middle EMA as a re-entry point in trends.
- Risk Management: Stops are best placed near the opposite band or based on ATR, and position sizes should adjust according to channel width.
Keltner Channels provide a clear framework for trading decisions, but success depends on proper setup, backtesting, and disciplined risk management. Pairing them with indicators like RSI, MACD, or volume analysis can strengthen trade signals and reduce false entries.
What Are Keltner Channels?
Keltner Channels are a type of volatility-based indicator that uses three lines to track price movement around an asset. These channels were popularized by Linda Bradford Raschke in the 1980s and rely on an Exponential Moving Average (EMA) and the Average True Range (ATR) to create smoother, more responsive bands.
The indicator includes a middle line (typically a 20-period EMA), an upper band (EMA + 2× ATR), and a lower band (EMA − 2× ATR). The middle line reflects the overall trend, while the outer bands define the range of typical price movement. When prices break beyond these outer bands, it can indicate either a continuation of the current trend or a potential reversal.
One unique aspect of Keltner Channels is how they adapt to market conditions. The bands expand when volatility (measured by ATR) increases and contract when volatility decreases, offering a dynamic view of market momentum and consolidation.
The Three Components Explained
Each part of the Keltner Channels plays a specific role:
- Middle Line (Trend Baseline): This is the 20-period EMA, which acts as a dynamic guide for the trend. In an uptrend, prices often bounce off this line as support, while in a downtrend, it serves as resistance. The slope of the EMA indicates the trend's direction - rising for bullish trends, falling for bearish trends, and flat for sideways markets.
- Upper Band (EMA + 2× ATR): This band highlights bullish momentum. Prices consistently near or above this level suggest strong upward movement. A close above the upper band may signal a breakout or trend acceleration.
- Lower Band (EMA − 2× ATR): This band reflects bearish momentum. Prices near or below this level point to strong downward pressure. A break below the lower band can indicate a trend reversal or the start of a new downtrend.
When prices stay between the upper and lower bands without touching them, the market is likely range-bound, signaling a lack of strong directional momentum.
Here's a breakdown of the components:
| Component | Standard Formula | Function |
|---|---|---|
| Middle Line | 20‑period EMA | Tracks the baseline trend direction |
| Upper Band | EMA + (2 × ATR) | Defines the boundary for bullish moves |
| Lower Band | EMA − (2 × ATR) | Defines the boundary for bearish moves |
Understanding these elements also sets the stage for using channel width as a tool to measure market volatility.
How Channel Width Reflects Volatility
The width of the Keltner Channels provides important clues about market volatility. Keltner Channel Width (KCW) measures the distance between the upper and lower bands as a percentage of the middle line. This approach smooths out volatility readings, making it less sensitive to sudden price spikes or outlier candles compared to indicators based on standard deviation.
- Low Channel Width (Compression): Narrow channels indicate a "coiled" market, often a precursor to a significant move. For example, in mid-January 2025, SPY ETF's daily price range contracted to $3.37 on January 16, with KCW hitting its lowest point. By January 17, KCW began to rise, signaling the start of a directional move.
- Rising Channel Width (Breakout Confirmation): An increase in channel width confirms that a breakout is driven by sustained momentum. On January 7, 2025, NVIDIA's KCW expanded sharply as ATR surged, confirming a breakdown from $149. This marked a true volatility event. A subsequent narrowing of the channel width may suggest that the market is losing momentum or entering a consolidation phase.
Traders can use channel width to adjust their strategies. For instance, during high-volatility periods, they might increase position sizes, while a peak in KCW could signal an opportunity to take profits or tighten stop-loss levels as momentum begins to fade.
Setting Up Keltner Channels on Your Platform
Keltner Channel Settings Guide for Different Trading Styles
Getting Keltner Channels up and running on your trading platform is straightforward, thanks to built-in tools or downloadable custom indicators. The key lies in knowing where to find the feature and adjusting the settings to align with your trading strategy.
Now that you understand how Keltner Channels work, let’s walk through how to set them up.
Standard Settings and Custom Adjustments
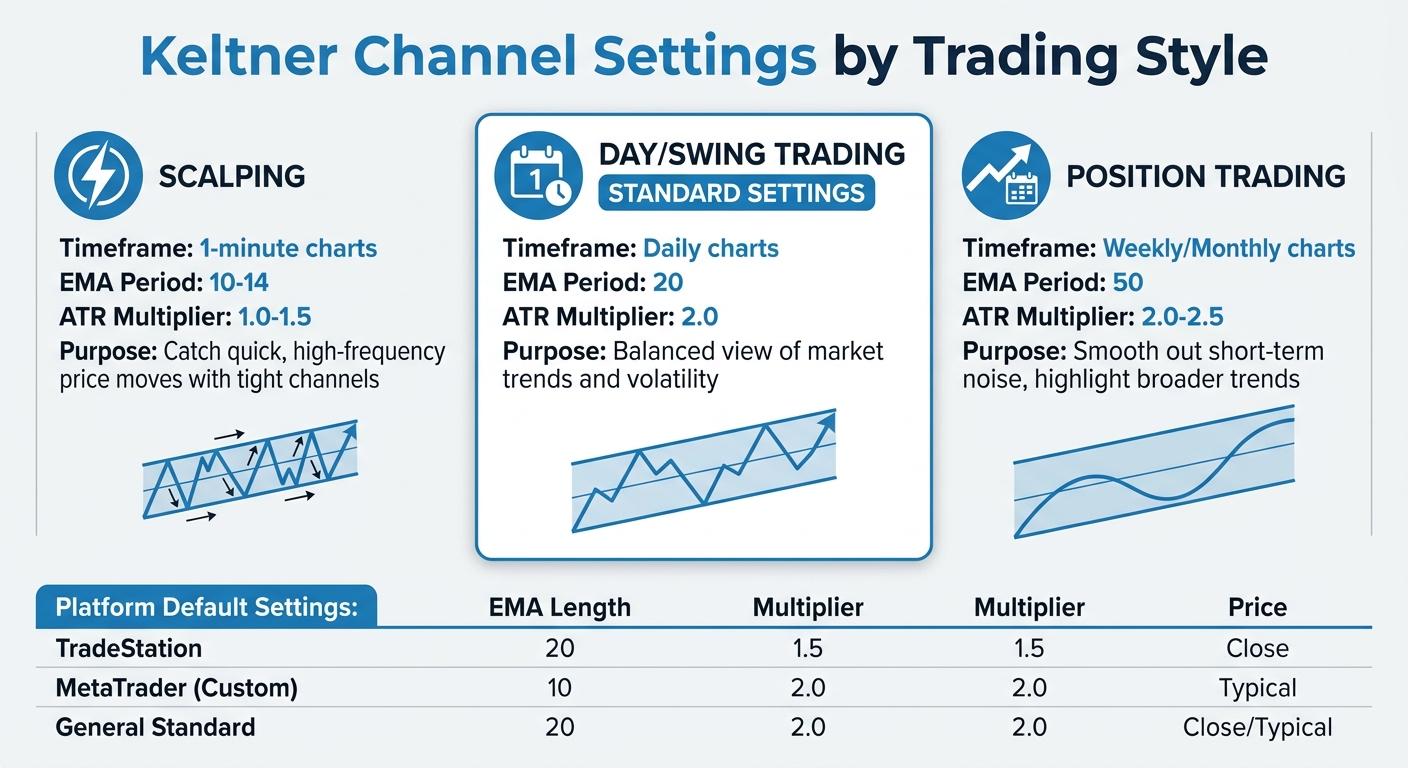
The default setup for Keltner Channels typically includes a 20-period Exponential Moving Average (EMA) as the midline, with the channels set at 2.0 times the Average True Range (ATR). This configuration strikes a balance between responsiveness and stability, especially on daily charts in liquid markets. However, you can tailor these settings based on your trading approach:
- Scalping (short timeframes like 1-minute charts): Use a shorter EMA period (10 to 14) and a lower ATR multiplier (1.0 to 1.5). This setup keeps the channels tight, making it easier to catch quick, high-frequency price moves.
- Day or swing trading (daily charts): Stick to the standard 20-period EMA and 2.0 ATR multiplier. This combination provides a balanced view of market trends and volatility.
- Position trading (longer-term focus): Opt for a longer EMA period (around 50) with an ATR multiplier of 2.0 to 2.5. This helps smooth out short-term noise and highlights the broader trend.
Getting the settings right is crucial for using Keltner Channels effectively, as it directly impacts your ability to pinpoint market entry and exit points.
Here’s a quick summary of the recommended settings for different trading styles:
| Trading Style | EMA Period | ATR Multiplier |
|---|---|---|
| Scalping (e.g., 1-min charts) | 10–14 | 1.0–1.5 |
| Day/Swing Trading | 20 | 2.0 |
| Position Trading | 50 | 2.0–2.5 |
Once you’ve decided on the settings that suit your style, you’re ready to set up the indicator on your platform.
Setup on NinjaTrader, MetaTrader, and TradeStation
TradeStation
To configure Keltner Channels in TradeStation, open the Analysis Techniques menu and search for "Keltner Channel." The default settings usually include a Length of 20, a NumATRs multiplier of 1.5, and Price set to Close. Adjust the multiplier to 2.0 for a more standard setup. If you’re coding strategies, you can use the following function:
KeltnerChannel(Close, 20, 1.5)
Modify the parameters as needed to match your preferred configuration.
NinjaTrader
In NinjaTrader, locate Keltner Channels in the Indicators list. Add it to your chart, then open the properties window to adjust the EMA period and ATR multiplier. Make sure you’re using the version based on EMA, as some platforms might offer SMA-based alternatives.
MetaTrader (MT4/MT5)
MetaTrader doesn’t always include Keltner Channels by default, so you may need to download a custom indicator. Once installed, go to the Indicators menu and look under Trend or Custom Indicators. Key parameters to configure include:
- maPeriod: Set your desired EMA length.
- multiInp: Adjust the ATR multiplier.
-
maMode: Ensure this is set to
MODE_EMAfor proper calculations.
The indicator calculates the bands as follows:
Run 24/7 while you sleep. Keep bots, platforms, and trade copiers online on a dedicated VPS.
Low-latency VPS hosting for your trading platform.
From $59.99/mo
- Upper Band = EMA + (Multiplier × ATR)
- Lower Band = EMA − (Multiplier × ATR)
Here’s a quick comparison of default settings across platforms:
| Platform | Default EMA Length | Default Multiplier | Default Price Input |
|---|---|---|---|
| TradeStation | 20 | 1.5 | Close |
| MetaTrader (Custom) | 10 | 2.0 | Typical |
| General Standard | 20 | 2.0 | Close/Typical |
Once your Keltner Channels are set up, confirm that the bands expand during volatile periods and contract during consolidations. If the bands remain static or fail to respond to price movements, double-check that the ATR is being used for calculations instead of standard deviation.
Trading Strategies with Keltner Channels
Once your Keltner Channels are set up, you can use them to guide your trading decisions. Two popular methods are breakout strategies, which focus on capitalizing on strong price movements, and pullback strategies, which aim to join ongoing trends at more favorable price levels. Both approaches rely on analyzing how prices interact with the bands and the middle EMA.
Breakout Strategy: Spotting Moves Beyond the Bands
A breakout happens when a candle closes outside either the upper or lower band. A close above the upper band signals a bullish breakout, while a close below the lower band indicates a bearish breakout. Since the standard Keltner Channel settings are designed to capture most price action, any movement beyond the bands is worth noting.
The most reliable breakouts often occur after periods of low volatility when the bands narrow, creating the potential for explosive moves as the market "releases" built-up energy.
To avoid getting caught in false breakouts, look for additional confirmation. For example, a volume spike, an ADX reading above 20–25, or observing the next candle’s behavior can help validate the breakout. Tim T. from the ChartsWatcher Research Team emphasizes this point:
"If the price breaks out and then closes back inside the channel on the very next candle, the trade is invalidated. I'll exit immediately for a small loss rather than hoping it turns around".
There are two ways to enter a breakout trade:
- Aggressive Entry: Jump in immediately after a candle closes beyond the band. This approach aims to capture the full move but comes with a higher risk of fakeouts.
- Conservative Entry: Wait for a breakout, then enter after a successful retest. This means the price pulls back toward the centerline (EMA) but stays between the EMA and the outer band for 2–3 candles. This method improves the risk-to-reward ratio by confirming the breakout's strength.
For stop-loss placement, consider positioning your stop just beyond the middle EMA, whether you're going long or short. You can also use the middle EMA as a trailing stop. If the price closes below the EMA (for long trades) or above it (for short trades), it may signal that momentum has weakened.
If a breakout looks overextended, you might want to switch to a pullback strategy to enter the trend at a better price.
Pullback Strategy: Joining Trends at Lower Risk
When breakouts seem unreliable, the pullback strategy offers a more cautious way to enter a trend. In strong trends, prices often hover near the upper or lower bands with limited retracements. Instead of chasing these moves, the pullback strategy lets you wait for a temporary retreat to the middle EMA.
To confirm an uptrend, ensure the price is above the middle EMA and that the EMA has a positive slope. Enter when the price pulls back from the upper band to the middle EMA, tests it, and then closes back above the EMA, resuming the upward trend. For downtrends, wait for a pullback from the lower band to the middle EMA, then enter short when the price closes back below the EMA.
The ChartsWatcher Research Team describes this dynamic well:
"The channel literally breathes with the market. When things are calm and volatility is low, the bands get tighter. When the market gets wild, the bands expand to contain the price action".
Place your stop-loss just outside the opposite band to account for potential volatility. For instance, in a long pullback trade, the stop-loss would go below the lower band. This placement acknowledges that reaching the opposite band could signal a failed trend. Additionally, during periods of high momentum, you might consider taking partial profits while the price rides the upper or lower band.
Pullback strategies generally carry less risk than breakout trades since you're entering near a support or resistance level rather than chasing a potentially overextended move. Backtests have shown that Keltner Channel strategies, when applied effectively, can achieve a win rate of around 77% in certain scenarios.
Combining Keltner Channels with Other Indicators
Once you've set up your Keltner Channels, incorporating additional indicators can help refine your trade signals. By pairing Keltner Channels with tools like momentum and trend indicators, you can cut through market noise and gain a clearer picture. While the bands highlight volatility, these extra tools confirm whether the momentum is genuine. Commonly used indicators include RSI, MACD, ADX, and volume analysis, each adding a unique layer of insight.
Risk Management Examples Using the Keltner Channel Structure
The setup you build means nothing if your risk placement is guesswork. Using the Keltner Channel as a structural anchor for stops and exits turns the indicator from a signal tool into a full decision framework. The center line defines the difference between a healthy pullback and a trend that has broken down, and the bands tell you when volatility has expanded beyond what your thesis can absorb.
One of the biggest mistakes traders make with Keltner Channels is treating every band interaction the same way, regardless of market conditions. In reality, the same signal can mean two completely different things depending on whether the market is trending or ranging. That’s why experienced traders often introduce regime filters before acting on any Keltner-based setup.
Filter 1: Trend Strength (Using ADX as a Context Check)
Keltner signals behave very differently depending on underlying trend strength.
When trend strength is high, price tends to respect directional movement—pullbacks and band interactions often act as continuation signals rather than reversals.
When trend strength is weak, price becomes unstable and reactive, meaning band touches are more likely to fail or reverse quickly.
Practical application
- In strong trend conditions, prioritize continuation-style setups (pullbacks toward the center line or shallow retracements).
- In weak trend conditions, be more cautious with breakout trades and reduce reliance on momentum-based entries.
Why this matters
Without this filter, traders often apply trend strategies in environments that are effectively range-bound—leading to repeated false breakouts and unnecessary stop-outs.
Filter 2: Higher-Timeframe Structure Alignment
Another major source of failed Keltner signals is trading against the dominant structure of the higher timeframe. Lower timeframes can look active and directional, but still be trapped inside a broader opposing trend or consolidation zone.
Practical application
- Use a higher timeframe as a directional bias filter (e.g., 1H or 4H trend direction).
- Prefer long setups when price is holding above higher-timeframe equilibrium.
- Prefer short setups when the price is below it.
- Avoid taking signals when the higher timeframe is flat or directionless.
Why this matters
Most “good-looking” setups fail not because the entry is wrong, but because they are executed against the dominant liquidity flow.
Combining Filters Into a Simple Decision Rule
The highest-quality Keltner setups typically occur when both conditions align:
- Trend strength supports the direction (not choppy conditions)
- Higher-timeframe structure agrees with the trade bias
When these filters disagree:
- reduce position size, or
- demand stronger confirmation, or
- skip the trade entirely
This is where consistency improves—not from better entries, but from fewer low-quality trades.
Risk Management Using the Keltner Channel Structure
Once market conditions are filtered, the Keltner Channel itself becomes a framework for defining risk, not just entries. Instead of treating stops and exits as emotional decisions, traders anchor them to channel structure—specifically the center line and outer bands.
Example 1: Trend Pullback Into the Center Line
Assume a liquid FX pair or index CFD where:
- ATR (14) = 20 pips
- Keltner Channel width (Upper to Lower) = ~60 pips
- Center line = EMA (20)
Price is in an uptrend and pulls back toward the center line.
Entry assumption
- Long entry near the center line (EMA)
Risk definition (structured)
- Conservative stop: below last swing low = -25 to -35 pips
- Channel-based stop: below lower band = ~ -60 pips
Position sizing example
If account risk = 1% ($1,000 on a $100k account)
- Stop = 30 pips → pip value = $33.33 per pip
- Position size = ~$33 per pip exposure
OR channel-based
- Stop = 60 pips → position size halves automatically
Key insight
Wider volatility (channel expansion) forces smaller size—even if the setup is identical.
Trade management
- Take partial profit at +30 to +40 pips (upper band approach)
- Trail remainder using center line (EMA)
Stay online and closer to execution. Choose a VPS location for CME futures, New York markets, London FX, API trading, and more.
Host your platform near the market route that matters.
From $59.99/mo
Example 2: Momentum Continuation Near Upper Band
Assume
- ATR = 18 pips
- Price is holding above EMA and repeatedly tagging the upper band
Entry assumption
- Long continuation on shallow pullback
Risk options
- Aggressive stop: -15 to -20 pips (below EMA)
- Structure stop: -25 to -30 pips (recent swing low)
Position sizing (1% risk example)
- 20 pip stop → $50 per pip position size
- 30 pip stop → $33 per pip position size
Key insight
Same setup, but volatility structure changes position size by ~35% difference in exposure
Trade management
- Trail stop under EMA once price moves +1R (20–30 pips)
- Exit partial at +1.5R to +2R near upper band continuation
Example 3: Range Mean Reversion Setup
Assume
- ATR = 12–15 pips
- Tight, sideways market
- Channel width = ~35–45 pips
Entry assumption
- Short near the upper band or long near the lower band
Risk definition
- The stop is placed 5–10 pips beyond the band
- Example: upper band = 1.1050 → stop = 1.1060 (+10 pips buffer)
Position sizing
If risking 1% ($1,000):
- 10 pip stop → $100 per pip exposure
- 15 pip stop → $66 per pip exposure
Key insight
Range trading naturally forces:
- tighter stops
- but higher stop-out frequency
Trade management
- First target = center line (mean reversion zone)
- Second target = opposite band only in stable ranges
Core Risk Rule (Institutional Framing)
Across all regimes
- Trend trades = wider stops, smaller size, higher reward expansion
- Range trades = tighter stops, smaller targets, higher frequency of invalidation
- Breakout trades = volatility-adjusted sizing is mandatory, not optional
Critical Insight Most Retail Traders Miss
If you remove volatility from your risk model:
- You over-size in high volatility conditions
- You under-trade in low volatility conditions
- and your strategy becomes inconsistent even if your entries are correct
👉 Keltner Channels solve this by forcing risk to scale with structure, not emotion.
If you want to put this into practice at speed, order execution has to match your analysis. A trading VPS from QuantVPS gives prop traders the low-latency infrastructure to act the moment channel conditions are met, so your risk parameters execute as designed, not as delayed.
Adding Volume Analysis for Trade Confirmation
Volume analysis is a powerful tool for distinguishing real breakouts from false ones. A breakout beyond the Keltner Channel bands accompanied by high trading volume is far more reliable than one with weak participation. Ideally, volume should exceed the 20-period moving average by at least 1.2× to confirm the breakout.
When the price closes beyond the upper or lower band, check for a noticeable spike in trading volume. Breakouts with high volume are more likely to sustain, while those on low volume often lead to reversals back into the channel range. In an uptrend, if the price "walks" along the upper band, steady or rising volume signals a healthy trend.
During range-bound markets, where prices frequently touch the bands, volume can act as a filter to avoid entering trades based on weak signals. This approach ensures you focus on moves supported by strong participation, aligning with the breakout and pullback strategies discussed earlier.
Managing Risk and Optimizing Performance
When it comes to trading with Keltner Channels, managing risk effectively is what sets successful traders apart from those who face heavy losses. The channel’s volatility-based structure offers natural points for setting stops and sizing positions, but disciplined execution is key. Below, we’ll dive into how to strategically place stop-loss orders and adjust position sizes based on market conditions.
Where to Place Stop-Loss Orders and Size Positions
Stop-loss placement depends on your strategy. For breakout trades, position your stop just inside or outside the opposite channel band. This approach provides enough breathing room while guarding against false signals. For example, if you’re long after a breakout above the upper band, place your stop near the lower band. On the other hand, for trend-following strategies, the middle EMA serves as a dynamic trailing stop - exit when the price closes on the opposite side. Alternatively, you can set stops below the most recent swing low for long trades and above the swing high for shorts.
Use ATR-based stops to match market volatility. The Average True Range (ATR) is a handy tool for adjusting stops. A stop set at 1.5× ATR works well for tight day trading, 2.0× ATR suits swing trades, and 3.0× ATR is better for long-term trends.
Position size should adapt to channel width. When the bands widen due to high volatility, reduce your position size to keep your risk consistent. Conversely, narrow bands in low-volatility markets allow for standard or slightly larger positions. A straightforward method is to risk a fixed percentage of your capital per trade - commonly 1%. To calculate the number of shares, divide your risk capital by the distance to your stop.
| Market Condition | Position Size | Stop Loss Placement | Risk-Reward Target |
|---|---|---|---|
| Strong Trend | Standard | Below Centerline EMA | 3:1 or higher |
| Sideways/Range | Reduced | Just outside opposite band | 1.5:1 to 2:1 |
| High Volatility | Significantly Reduced | 1.5× ATR below entry | 2:1 (exit early if needed) |
| Low Volatility | Standard/Increased | Just outside opposite band | Wait for breakout to define |
Once your risk parameters are set, thorough testing ensures they hold up across various market environments.
Testing and Refining Your Approach
Testing your strategy is critical to its success. Backtesting helps determine if your strategy works. Focus on three main parameters: the EMA length for the centerline, the ATR period, and the ATR multiplier for band width. Instead of testing on a single historical period, use sequential time windows to ensure your strategy performs consistently across different market conditions. For example, a Keltner Channel Breakout Strategy tested on BTC-USD from January 2018 to January 2025 evaluated 60 parameter combinations. The optimal setup - 50-period EMA, 14-period ATR, and a 2.0× multiplier - achieved a Sharpe Ratio of 1.11 and a 228.9% return during optimization. Notably, it excelled in bearish markets like 2018, delivering a +7.2% return while the benchmark dropped -72.6%.
Walk-forward analysis guards against curve-fitting. Once you’ve optimized your parameters on historical data, validate them on out-of-sample data to ensure reliability. Key metrics to monitor include Sharpe Ratio, total return, maximum drawdown, and win/loss ratios. Before going live, execute 50–100 paper trades to build confidence and discipline. Regularly review your strategy - quarterly is a good rule of thumb - to ensure it still aligns with the current market environment.
Conclusion
Keltner Channels provide a clear method for analyzing market trends and making trading decisions based on volatility. In strong trends, prices often stay near the upper band during uptrends or the lower band during downtrends, consistently remaining on one side of the middle EMA. A potential trend reversal may be indicated when prices fail to reach a channel on a bounce and instead cross the middle line.
You can tweak the EMA period and ATR multiplier to align with your trading approach. Price movements outside the bands are often statistically noteworthy and worth further analysis. This flexibility supports disciplined risk management across varying market environments.
When using Keltner Channels, risk management is key. Use the middle EMA as both a trend filter and a trailing stop, and adjust position sizes based on channel width - reducing exposure when the bands widen and maintaining standard sizing when the bands narrow. To limit losses, place stop-loss orders just outside the opposite band or at 1.5×–3.0× ATR, guarding against unfavorable moves.
Before committing real capital, backtest your parameters under different market conditions and conduct 50–100 paper trades. You might need to fine-tune the settings depending on the asset and timeframe you trade. Pairing Keltner Channels with momentum indicators like RSI or volume analysis can help confirm signals and minimize whipsaws, particularly in sideways or choppy markets. The strength of Keltner Channels lies in combining technical insights with diligent backtesting.
Start with the basics, test thoroughly, and refine your approach based on results. While Keltner Channels won't capture every market move, they provide a structured way to follow trends and manage the volatility that comes with trading.
FAQs
How do I choose the best EMA length and ATR multiplier for my timeframe?
To fine-tune the Keltner Channel strategy, it's all about finding the right balance between responsiveness and stability. For the EMA length, shorter periods like 10-20 are better suited for capturing quick price movements, while longer periods such as 30-50 are ideal for identifying broader market trends.
As for the ATR multiplier, it's commonly set at 2, but you can tweak it to adjust the channel width. A higher multiplier widens the bands, helping to filter out false signals, while a lower multiplier tightens the bands, making the strategy more sensitive to price changes.
The key is to backtest these variables thoroughly to discover the settings that align with your specific timeframe and trading style.
How can I tell a real Keltner breakout from a fakeout?
To identify a true Keltner breakout, watch for a sustained price movement that pushes beyond the channel. This should be backed up by signals like higher trading volume or several consecutive closes outside the band. On the other hand, a fakeout usually happens when the price briefly crosses the band but quickly reverses back into the channel. Paying attention to confirmation signals is key to distinguishing between real breakouts and false alarms.
What’s the simplest way to size positions using Keltner Channel width?
One straightforward method is to measure a channel's width as a percentage of its middle line - this is called the Keltner Channel Width (KCW). KCW can be used as a volatility filter to guide your trading decisions.
Here’s how it works:
- When KCW is high, it signals increased volatility. In such cases, it’s wise to take smaller positions to manage risk.
- When KCW is low, it indicates lower volatility, making it safer to take larger positions.
By incorporating KCW into your strategy, you can better balance risk and adjust trade sizes to match market conditions.


