Dispersion trading is a strategy that leverages the difference between the volatility of an index and its individual components. Here's the core idea: index options tend to be overpriced compared to single-stock options because portfolio managers overpay for index-level protection. Traders exploit this by selling index options and buying single-stock options, profiting when individual stocks move less in sync than expected.
Key Points:
- How It Works: Sell index options (e.g., S&P 500) and buy options on individual stocks within the index.
- Profit Driver: Lower realized correlation among stocks compared to the implied correlation priced into index options.
-
Benefits:
- Generates returns independent of market direction.
- Uses tools like the CBOE Implied Correlation Index to spot opportunities.
- Offers decorrelated returns from broader market trends.
- Risks: High realized correlations during market crises can lead to losses.
Example:
In 2023–2024, traders profited by shorting S&P 500 index options and going long on options for individual tech stocks like Apple and Tesla. While the index remained stable, these stocks moved independently, creating opportunities.
To succeed, traders must actively manage risks, monitor market conditions, and use advanced tools like delta hedging and high-performance trading setups. Dispersion trading requires precision but can deliver strong returns when executed effectively.
Core Concepts Behind Dispersion Trading
Implied Volatility vs. Realized Volatility
Dispersion trading revolves around two critical metrics: implied volatility (IV) and realized volatility (RV). Implied volatility reflects the market's forecast of future price swings, while realized volatility captures the actual price fluctuations over a past period. The gap between these two - referred to as the Volatility Risk Premium (VRP) - exists because options sellers demand compensation for the uncertainty they face.
| Metric | Implied Volatility (IV) | Realized Volatility (RV) |
|---|---|---|
| Nature | Forward-looking (expectation) | Backward-looking (actual data) |
| Source | Option market prices | Historical price data |
| Role in Dispersion | Sets the trade cost | Drives potential profit |
| Typical State | Generally higher (includes risk premium) | Typically lower |
"The high difference between the implied volatility of index options and subsequent realized volatility is a known fact. Trades routinely exploit this difference by selling options with consecutive delta hedging." - Quantpedia
This difference is usually more pronounced in index options compared to individual stock options. This asymmetry is what makes dispersion trading viable. Mastering these volatility concepts is the first step toward understanding how stock correlations further shape the strategy.
How Correlation Affects Dispersion Trading
The volatility of an index reflects more than just the average volatility of its components; it also depends on how those components move in relation to one another. When stocks move independently, their individual fluctuations tend to cancel each other out, keeping index volatility relatively stable. On the other hand, when stocks move in unison, the index experiences larger, more pronounced swings.
"Index variance decomposes into average single-name variance plus pairwise covariances (correlation). Dispersion trades exploit the gap between index volatility and average single-stock volatility." - Resonanz Capital
Dispersion trading is essentially a play on correlation. The goal is to profit when the realized correlation - how stocks actually move together - ends up being lower than the implied correlation baked into index options. Historical data from 1996 to 2003 revealed a Correlation Risk Premium (CRP) of 18 points, while more recent studies show a CRP of 6.7 to 8.9 points for 91-day options. Additionally, the CBOE Implied Correlation Index (COR1M/COR3M) serves as a useful signal: levels above 0.55–0.60 often indicate that index volatility is overpriced, while levels below 0.25 suggest that most of the premium has already been captured.
With correlation's role in dispersion trading clear, the next step involves structuring trades to isolate and capitalize on these dynamics.
Risk-Neutral Dispersion Profiles
To take advantage of the correlation gap, traders use risk-neutral profiles to focus on the profit potential from correlation while minimizing exposure to other market risks. These profiles are designed to neutralize specific sensitivities - known as "Greeks" - so that the trade's performance is driven primarily by the correlation dynamics.

Run 24/7 while you sleep. Keep bots, platforms, and trade copiers online on a dedicated VPS.
Low-latency VPS hosting for your trading platform.
 CHINYC
 LON
LONFrom $59.99/mo


 CHI/CME futuresNYC/US marketsLON/FX EAs
 DUB/Polymarket
 AMS/EU FX
 FRA/Central EU
 TYO/APAC crypto
The most widely used approach is the vega-flat strategy. This method involves balancing long single-stock options with short index options to achieve a net vega of zero, effectively neutralizing the trade's exposure to overall volatility changes. More advanced approaches include gamma-flat and theta-flat profiles, which reduce sensitivity to large price swings and time decay, respectively. However, these strategies require ongoing adjustments to maintain neutrality.
Another popular method is variance-notional parity, which scales positions to mimic the payout structure of variance swaps. This is crucial because variance swaps exhibit convexity in volatility - losses on a short index variance position can escalate rapidly during volatility spikes. Long single-stock positions, on the other hand, tend to offset these losses more predictably.
Selecting the right risk-neutral profile isn't just a theoretical exercise - it has a direct impact on how the trade performs under varying market conditions.
Dispersion Trading Structures and How They Work
Index vs. Component Options Structure
This section breaks down how dispersion trading is structured. Essentially, it’s about capitalizing on the imbalance between index and single-stock volatilities. The setup involves selling index options, usually ATM straddles on indices like the S&P 500, while simultaneously buying ATM straddles on a selection of the index’s individual stocks.
| Strategy Component | Long Leg (Components) | Short Leg (Index) |
|---|---|---|
| Key Instrument | Individual Stock Options (Straddles) | Index Options (SPX Puts or Straddles) |
| Volatility View | Long Implied Volatility | Short Implied Volatility |
| Correlation View | Expects lower realized correlation | Profits from high implied correlation |
| Greeks Profile | Long Vega, Long Gamma, Short Theta | Short Vega, Short Gamma, Long Theta |
The positions are scaled based on index weights, using the square of those weights ($w_i^2$) for variance-notional parity, ensuring the trade replicates variance swaps. By delta hedging, traders eliminate directional price exposure, focusing solely on correlation dynamics.
Here’s an example: in 2023 and 2024, traders applied this strategy to the S&P 500. They shorted SPX volatility and went long on the "Magnificent 7" stocks - Apple, Microsoft, Alphabet, Amazon, Nvidia, Meta, and Tesla. While the index remained mostly flat, these individual stocks moved more than 5% relative to one another, creating an ideal scenario to profit from the correlation gap.
"Because portfolio managers chronically overpay for index-level hedges, driving index vol structurally rich relative to fair value... a persistent gap emerges." - Convex Research Desk
The next section explains how to create a gamma-flat version of this trade to better manage risk.
How to Build a Gamma-Flat Dispersion Trade
A gamma-flat dispersion trade is designed to manage risk more effectively. The idea is to balance the short gamma exposure from the index leg with the long gamma from the single-stock leg, keeping the portfolio’s delta stable even as prices fluctuate.
Here’s how it’s done:
- Sell ATM straddles on a major index, such as the S&P 500.
- Select 30–50 stocks, often using Principal Component Analysis (PCA) to optimize for explanatory power while keeping transaction costs reasonable.
- Buy ATM straddles on these stocks and calculate weights ($w_i$) to offset the index gamma with the combined gamma from the components: $\sum w_i \Gamma_i + \Gamma_{Index} = 0$.
- Maintain delta neutrality by rebalancing whenever the portfolio delta moves beyond ±0.01–0.05% of notional.
This strategy proved effective during a market downturn, delivering a 9.18% return. Historically, delta-hedged dispersion trades on S&P 500 stocks from 2000 to 2017 generated annual returns of 14.52%, with Sharpe ratios between 0.34 and 0.40. However, hedging comes at a cost. Unhedged dispersion trades over the same period returned 26.51% annually, showing a 12 percentage point gap.
"By systematically selling overpriced index correlation and buying underpriced component volatilities - while maintaining rigorous delta-neutrality - banks extract consistent alpha from structural supply-demand imbalances." - Navnoor Bawa, Quantitative Researcher
Vega-Flat and Theta-Flat Strategies
These two strategies tweak the core trade to neutralize specific risks.
- Vega-Flat Strategy: This approach matches the vega of the single-stock leg with the vega of the index leg. If implied volatility shifts by one absolute point, gains and losses on both sides cancel out, leaving only correlation exposure.
- Theta-Flat Strategy: Here, the vega is weighted by the square root of variance. Since single-stock volatility tends to be higher than index volatility, this method requires a smaller single-stock vega leg compared to the vega-flat setup. The focus is on neutralizing time decay rather than volatility shifts, protecting against relative percentage changes in volatility.
"Theta weighting can be thought of as correlation-weighted... If volatility rises 1% (relative move) the two legs cancel and the dispersion breaks even." - Alex, Quantitative Finance Stack Exchange
Choosing between these strategies depends on your market outlook. Use the vega-flat structure for straightforward correlation exposure. Opt for theta-flat when time decay is a concern or when you expect volatility to shift in percentage terms rather than absolute points. These refinements allow for better risk management and tailored trade execution.
How to Implement Dispersion Trading Strategies
Pre-Trade Analysis and Strategy Selection
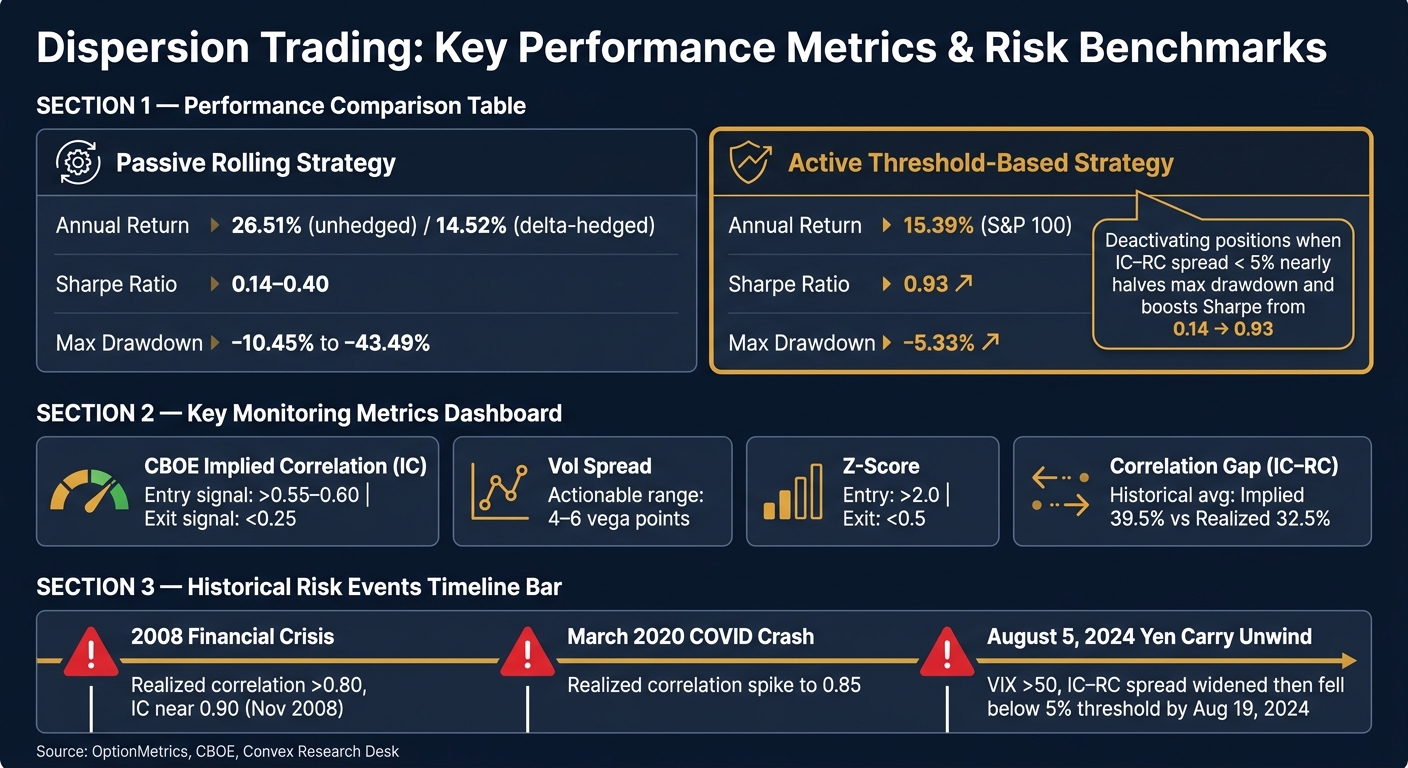
Before diving into a dispersion trade, ensure the dispersion premium is wide enough to justify the effort. Start by checking the CBOE Implied Correlation Index (IC). Readings above 0.55–0.60 typically indicate a favorable setup. Another key signal is a volatility spread of 4–6 vega points between a basket of the top 50 S&P 500 stocks and the index itself.
However, numbers alone don’t tell the full story. Dispersion trades thrive when individual stocks move independently. They tend to falter during "risk-off" periods where correlations spike across the board. For example, during the 2008 financial crisis, realized correlations shot up past 0.80, and the CBOE Implied Correlation Index nearly hit 0.90 in November 2008. A similar surge to 0.85 occurred in March 2020. These episodes highlight the risks of extreme market conditions. Ahead of major macro events - like FOMC meetings or CPI announcements - consider cutting back on short-correlation exposure or adding hedges to protect against tail risks.
"A dispersion trade is effectively a bet that realized single-stock correlations will be lower than the correlation implied by index vol." - Convex Research Desk
For an entry trigger, use a Z-Score above 2.0 and plan to exit when it drops below 0.5. Dispersion trading also requires a solid capital base - at least $50,000 - to ensure adequate diversification across the multi-leg structure.
Once these metrics confirm the trade setup, the next step is to create a stock basket that mirrors the index’s variance exposure as closely as possible.
Building and Weighting the Stock Basket
With the dispersion signal validated, focus on constructing a basket of stocks. The top 50 S&P 500 constituents are ideal because they account for the majority of the index’s variance and offer the liquidity needed to keep transaction costs manageable.
The main challenge here is tracking error. If the behavior of your stock basket diverges too much from the actual index, losses can pile up on both legs of the trade. To minimize this risk, stick to large-cap, liquid stocks. Many traders limit their baskets to 30–50 names, avoiding the complexity of replicating all 500 components.
Hedging, Monitoring, and Execution Infrastructure
Dispersion trading success doesn’t stop at strategy design. Daily monitoring and robust execution are just as critical. Keep a close eye on your Greeks and correlation matrix to ensure your position remains within the intended risk profile.
Two key thresholds to monitor are:
Stay online and closer to execution. Choose a VPS location for CME futures, New York markets, London FX, API trading, and more.
Host your platform near the market route that matters.
CHINYCLONFrom $59.99/mo
CHI/CME futuresNYC/US marketsLON/FX EAsDUB/PolymarketAMS/EU FXFRA/Central EUTYO/APAC crypto- Value at Risk (VaR): Limit this to 2% of your portfolio.
- Maximum Drawdown: Cap this at 15% to avoid excessive losses.
If either limit is breached, adjust your position immediately. Maintaining delta neutrality is also essential - rebalance whenever the portfolio delta drifts beyond your predefined tolerance range.
From an operational standpoint, dispersion trading involves juggling at least 21 instruments - 20 individual stock options and one index option - and often many more. Multi-leg execution requires a low-latency setup to avoid slippage, which can quickly eat into your correlation premium. A high-performance VPS, such as QuantVPS, can make a big difference. Their Ultra plan (24 cores, 64GB RAM) offers 0–1ms latency, 100% uptime, and NVMe storage, making it easier to handle real-time data feeds and automated delta hedging.
"Institutional investors can unlock unprecedented transparency and reframe dispersion as a science rather than an art form by utilizing robust historical implied correlation data and highly flexible options benchmarking software." - OptionMetrics
For monitoring, tools like the Cboe S&P 500 Dispersion Index (DSPX) - introduced in September 2023 - provide a standardized 30-day dispersion benchmark. Pair this with the VIX, which tracks index-level implied volatility in real time. Keeping both on your dashboard helps you spot when the IC-RC spread narrows, signaling it’s time to exit the position.
Evaluating and Improving Dispersion Strategies
Dispersion Trading: Key Performance Metrics & Risk Benchmarks
Measuring Returns and Risk Metrics
To gauge the performance of dispersion trades, focus on realized variances and key option pricing factors. Three elements play a central role: the realized variance of individual stock positions, the realized variance of the index, and shifts in implied volatility and skew, which directly influence option pricing.
One critical real-time indicator is the correlation gap, which tracks the difference between 30-day realized correlation and the current implied correlation (IC). If realized correlation stays below the implied level, the trade is generally in a profitable zone. However, when the gap narrows or reverses, it signals potential trouble.
For assessing risk-adjusted performance, the Sharpe ratio is a widely used metric. Dispersion strategies that actively adjust based on correlation thresholds have achieved Sharpe ratios as high as 0.93.
| Metric | What It Measures | Target Range |
|---|---|---|
| COR1M / COR3M | Implied correlation level | 0.35–0.45 (historical avg) |
| Sharpe Ratio | Risk-adjusted return | 0.40–0.93 (strategy range) |
| Vol Spread | Actionable dispersion premium | 4–6 vega points |
| Realized Correlation | Actual stock co-movement | Below implied correlation |
Using these metrics as a foundation, active adjustments to market conditions are crucial for maintaining performance.
Adjusting for Changing Market Conditions
Static dispersion strategies often falter as market correlation regimes evolve. Instead of treating the IC-RC spread merely as an entry signal, use it as a dynamic tool for active management.
Positions should be reduced or deactivated when the IC-RC spread drops below 5%. Research by Garrett DeSimone, PhD, from OptionMetrics, demonstrates that applying this threshold can significantly improve performance. This approach led to a Sharpe ratio of 0.93 and a maximum drawdown of –5.33%, compared to a larger –10.45% drawdown seen in passive rolling strategies.
"The implementation of an active dispersion incorporating a 5% (IC-RC) threshold demonstrates superior risk-adjusted performance compared to vanilla approaches." - Garrett DeSimone, PhD, OptionMetrics
Historical data supports this strategy. Between 2013 and 2017, realized pairwise correlations fell to the 0.15–0.25 range, offering a prolonged period of favorable carry with manageable drawdowns. Conversely, on August 5, 2024, during a yen-carry trade unwind, the VIX surged above 50, and the IC-RC spread widened sharply before falling below the 5% threshold on August 19, 2024. This underscores the importance of strict stop-loss rules during extreme market events.
This active approach ensures better alignment with market conditions and enhances operational precision.
Optimizing Execution with High-Performance VPS Hosting
Active dispersion trading demands swift and precise adjustments, making high-performance VPS hosting a critical tool. Managing at least 21 instruments simultaneously requires constant recalculations of the IC-RC spread, monitoring of Greeks, and frequent delta hedging. These intensive tasks can overwhelm local systems and standard internet connections.
A high-performance VPS solves these challenges by running trading algorithms continuously and positioning them close to exchange servers to reduce latency. For instance, QuantVPS offers tailored solutions for such workloads. Its Ultra plan (24 cores, 64GB RAM, 500GB NVMe) provides near-zero latency (0–1ms) and 100% uptime, ensuring automated delta hedging and real-time monitoring during volatile periods.
For traders managing multiple dispersion books or monitoring numerous index-component pairs, the Dedicated Server plan (16+ dedicated cores, 128GB RAM, 2TB+ NVMe, 10Gbps+ network) offers even greater capacity. In a world where milliseconds can make or break a trade, investing in high-performance VPS hosting is a game-changer.
Conclusion: Key Takeaways for Dispersion Trading
Dispersion trading takes advantage of the consistent overpricing of index-level correlation compared to actual realized correlation. When realized correlation remains lower than implied correlation, the strategy captures the premium. Historical S&P 500 data shows this gap has been persistent, with average implied correlations at 39.5% and realized correlations at 32.5%. This discrepancy has drawn institutional interest for years.
The strategy involves selling index options while buying options on individual components, ensuring vega-neutrality and frequently hedging delta to focus on the correlation premium. While historical backtests show that dispersion strategies can deliver strong returns, they also highlight the potential for significant drawdowns. For instance, S&P 100 dispersion strategies have shown annual returns of 15.39% but faced a maximum drawdown of –43.49%. This underscores the importance of active management.
Switching from a passive rolling strategy to an active, threshold-based approach has shown to improve results significantly. For example, deactivating positions when the implied correlation (IC) minus realized correlation (RC) spread falls below 5% has historically reduced maximum drawdowns by nearly half and boosted Sharpe ratios from 0.14 to 0.93. This single adjustment has proven to make a noticeable difference in performance.
"The profitability of this strategy hinges on a low-correlation environment - put simply, it benefits when stocks move in different directions." - OptionMetrics
Efficient execution is essential for capturing the dispersion premium. Managing over 20 positions, performing continuous Greeks calculations, and executing timely delta hedging all require robust operational infrastructure. High-performance VPS hosting, such as QuantVPS, ensures automated systems execute trades reliably, even during market volatility, thanks to near-zero latency and uninterrupted uptime. By combining active management with dependable VPS hosting, traders can better navigate risks and maximize the potential of dispersion trading.
FAQs
What market conditions make dispersion trades fail?
Dispersion trades can falter when stock correlations spike, which often happens during market downturns. This surge in correlation reduces the gap between index and individual stock volatilities, making the strategy less effective. Additionally, these trades struggle if implied volatility closely matches realized volatility or if the difference between them shrinks. Sudden market stress or shifts in investor sentiment can also disrupt the strategy by unexpectedly increasing correlations, undermining its core assumptions and profitability.
How do I size the index leg vs. the stock basket?
To determine the right size for the index leg compared to the stock basket in dispersion trading, focus on analyzing the implied volatility of both index options and individual stock options. Start by calculating the ratio of the index’s implied volatility to the average implied volatility of the stocks. Then, adjust your positions based on this ratio, taking into account the expected correlation and volatility premiums. This approach helps maintain balanced exposure to the correlation risk premium while staying aligned with the core principles of a dispersion strategy.
Do I need variance swaps to run dispersion trading?
Variance swaps aren't the only tool for dispersion trading. You can also use options or other derivatives like volatility swaps to execute these strategies. The decision on which instrument to use ultimately depends on your specific trading style and the prevailing market environment.