Trailing drawdown is a moving loss limit designed to protect profits as your account grows. Unlike a fixed drawdown, it adjusts upward when your account reaches new peaks but never moves downward after losses. Here’s what you need to know:
-
How It Works:
- Starts with an initial limit based on your starting balance (e.g., 10% of $100,000 = $90,000).
- As your balance grows, the drawdown limit increases (e.g., $110,000 peak → $99,000 limit).
- The limit stays fixed even if your balance drops later.
-
Why It’s Used:
- Encourages disciplined trading by locking in profits.
- Helps prop firms manage risk while rewarding consistent growth.
-
Calculation Methods:
- End-of-Day (EOD): Adjusts at the close of each trading day.
- Intraday: Updates in real-time based on unrealized gains.
-
Key Example:
Starting with $50,000 and a $2,000 drawdown:- EOD: If you close at $51,000, the limit adjusts to $49,000.
- Intraday: If your balance peaks at $51,500, the limit adjusts immediately to $49,500.
Quick Comparison
| Aspect | Trailing Drawdown | Static Drawdown |
|---|---|---|
| Risk Limit | Adjusts upward with growth | Fixed throughout |
| Profit Protection | Locks in gains | No automatic protection |
| Complexity | Dynamic, requires monitoring | Simple, easy to track |
| Psychological Impact | Can create pressure | Predictable, less stressful |
Trailing drawdown promotes smarter risk management but requires understanding its rules and psychological impacts. For effective trading, monitor limits closely and consider tools like VPS for uninterrupted performance.
How Trailing Drawdown Works
Basic Mechanics Explained
Trailing drawdown operates on a straightforward principle: as your account balance grows, the drawdown threshold moves upward. However, losses don't drag it back down. For instance, if you make a $2,000 profit, the threshold rises accordingly. But if you later incur a $1,000 loss, the threshold remains locked at its higher level.
There are two main ways to calculate trailing drawdown:
- End-of-Day (EOD) Trailing Drawdown: Adjustments happen only at the close of the trading day, based on your closing balance.
- Intraday Trailing Drawdown: Adjustments occur in real-time throughout the trading day, factoring in unrealized gains.
Once you hit the profit target, the trailing mechanism locks the drawdown threshold in place, even if you later experience losses.
Each method has its own nuances, which are best understood through examples.
Real Trading Example
Imagine starting with a $50,000 account and a $2,000 drawdown limit. Here's how the two methods play out:
EOD Trailing Drawdown Scenario:
- Day 1: Your account begins at $50,000, with the drawdown limit set at $48,000. During the day, your balance peaks at $51,500, but you close at $51,000. Since EOD calculations only consider the closing balance, the drawdown threshold adjusts to $49,000 ($51,000 - $2,000).
- Day 2: Your account peaks at $55,000 intraday but closes at $52,500. The new drawdown threshold locks in at $50,500 ($52,500 - $2,000). Even if your account drops below this level later, the threshold remains fixed.
Intraday Trailing Drawdown Scenario:
- Day 1: Starting with the same $50,000 account, your balance hits $51,500 intraday. With the intraday method, the drawdown threshold adjusts immediately to $49,500 ($51,500 - $2,000).
- Day 2: Your account balance rises to $55,000 intraday, pushing the drawdown threshold to $53,000 ($55,000 - $2,000). If your balance drops below $53,000 at any point during the day, you fail the challenge immediately, with no chance to recover until the next trading session.
The choice between these methods influences how you manage risk. EOD calculations give you more flexibility during volatile trading, while intraday calculations require stricter risk management but offer faster profit protection. Each approach suits different trading styles and risk tolerances.
How to Calculate Trailing Drawdown
The Calculation Formula
Calculating trailing drawdown is simple once you understand its components. The formula is:
Current Drawdown Threshold = Current Account Balance - Maximum Drawdown Amount
Here’s a breakdown of the key terms:
- Peak Value: The highest account balance achieved, which can be calculated intraday or at the end of the day, depending on your firm's rules.
- Current Balance: The current value of your account. This may include unrealized profits, depending on the calculation method used.
- Maximum Drawdown Amount: The fixed amount your account can lose before it is paused or closed.
An important note: The threshold only moves upward with account growth - it never decreases after a loss. The calculation method can vary slightly. For instance, End-of-Day (EOD) calculations use the daily closing balance as the peak, while intraday methods consider real-time highs, including unrealized gains from open positions.
Let’s walk through an example to see how this works in practice.
Step-by-Step Calculation
To make the formula clearer, here’s a practical example. Imagine you have a $100,000 account with a $3,000 trailing drawdown threshold under a funded trading account setup (the $3,000-on-$100K figure is typical of what futures prop firms use).
-
Initial Setup:
Starting with a $100,000 balance, your initial minimum balance is $97,000 ($100,000 - $3,000). -
Step 1 – After a Profit:
If you earn $2,000, your balance increases to $102,000. The new minimum balance is recalculated as $102,000 - $3,000 = $99,000. -
Step 2 – After a Loss:
If you lose $700, your balance drops to $101,300. However, the minimum balance remains locked at $99,000. This leaves you with a margin of $2,300 ($101,300 - $99,000). -
Step 3 – Further Profits & Locking:
If you earn another $2,700, your balance grows to $104,000. The new minimum balance adjusts to $104,000 - $3,000 = $101,000.
Some account structures lock the trailing drawdown once your profits equal the initial threshold (e.g., reaching $103,000 with a $3,000 drawdown), fixing the drawdown level at the original starting balance.
Here’s another example, using a percentage-based drawdown method:
- Starting with a $100,000 balance and a 6% trailing drawdown, your initial loss limit is $94,000.
- If your balance grows to $101,000, the trailing drawdown adjusts, setting a new loss limit at 94% of $101,000, which equals $95,000.
- Once your account hits $106,000, the trailing drawdown locks at the original $100,000 balance and stops moving upward [5].
Understanding these nuances is crucial to managing your trading account effectively. Now, let’s look at common mistakes traders make when calculating trailing drawdown.
Common Calculation Mistakes

Run 24/7 while you sleep. Keep bots, platforms, and trade copiers online on a dedicated VPS.
Low-latency VPS hosting for your trading platform.
 CHINYC
 LON
LONFrom $29.99/mo


 CHI/CME futuresNYC/US marketsLON/FX EAs
 DUB/Polymarket
 AMS/EU FX
 FRA/Central EU
 TYO/APAC crypto
Traders often run into issues when calculating trailing drawdown. Here are some common pitfalls to watch out for:
-
Misunderstanding Open Positions:
Intraday trailing drawdown often includes unrealized gains or losses from open trades. Focusing solely on closed trades can lead to incorrect thresholds. -
Mixing Calculation Methods:
Firms typically use either EOD or intraday methods - not both. Mixing them up can cause confusion and errors. -
Overlooking Locking Mechanisms:
Some firms lock the trailing drawdown once profits reach a certain threshold, which can impact your risk management strategy. -
Confusing Percentages and Dollar Amounts:
Some firms use percentage-based drawdowns (e.g., 6% or 7%), while others use fixed dollar amounts (e.g., $3,000). Mixing these up can lead to costly mistakes.
To avoid these errors, it’s a good idea to monitor your firm's dashboard regularly. Many platforms offer real-time tracking tools, which help you stay within safe trading limits and eliminate guesswork.
How Trailing Drawdown Affects Your Trading
Encourages Smarter Risk Management
Trailing drawdown adjusts as your account grows, locking in profits and encouraging disciplined, well-thought-out trades. This system pushes traders to be selective, take profits strategically, and refine position sizing. While it promotes responsible risk management, it also introduces unique mental hurdles that traders must navigate.
Psychological Pressures on Traders
The dynamic nature of trailing drawdown limits can amplify psychological stress, potentially impacting your trading performance. Knowing that losses hurt about twice as much as gains, according to research, traders often face heightened anxiety or decision paralysis. This mental strain can lead to overly cautious behavior - or, conversely, overconfidence.
"Pain + Reflection = Progress." - Ray Dalio, Founder of Bridgewater Associates
Emotional trading, or trading "on tilt", becomes a real threat when you're close to hitting your drawdown limit. The fear of losing your funded account can lead to impulsive, poorly planned trades that deviate from your strategy. Consider the "Rule of 90", which states that 90% of new traders lose 90% of their initial capital within 90 days. To combat these pressures, focus on process over outcomes, set achievable goals, maintain a trading journal to monitor both trades and emotions, and take breaks to reset your mindset.
What Is the Difference Between Static and Trailing Drawdown?
Static drawdown is a fixed boundary. Trailing drawdown is a moving one. This fundamental difference changes how you make every decision on a funded account — from how long you keep a winning trade to how aggressively you size your next trade.
"Understanding the difference between static and trailing drawdown is essential — one stays fixed no matter what, while the other follows your equity up, locking in gains and raising the stakes with every profitable move."
| Feature | Static Drawdown | Trailing Drawdown |
|---|---|---|
| Boundary Type | Fixed, never moves | Moves upward with profits |
| Based On | Starting account balance | Peak equity reached |
| Risk as You Profit | Stays the same | Increases with gains |
| Predictability | ✅ Highly predictable | ❌ Shifts with performance |
| Pressure on Winning Trades | ✅ Low | ❌ High — locks in faster |
| Best For | Consistent, measured trading | Traders who scale quickly |
🎯 Key Point: With static drawdown, your risk floor is set in stone from day one. With trailing drawdown, every new profit peak raises that floor — meaning a big winning trade can actually reduce your margin for error going forward.
⚠️ Warning: Many traders underestimate trailing drawdown because they focus on winning — but the higher your equity climbs, the tighter your buffer becomes. Sizing aggressively after a strong run is one of the most common ways funded accounts get blown.
🔑 Takeaway: Knowing which drawdown model your funded account uses isn't optional — it's the single most important rule that should shape your position sizing, trade duration, and risk management on every single trade.

How does the math differ between static and trailing drawdown?
The math makes it clear. On a $50,000 account with a $5,000 static drawdown, your floor sits at $45,000 from day one and never changes. Grow the account to $60,000, and your floor remains $45,000—you have $15,000 of breathing room. With a trailing drawdown, growth works against you. According to Audacity Capital's trading guide on static vs. trailing drawdown, a trader who grows a $10,000 account to $11,000 will have their drawdown limit rise to $10,000. The floor climbs with the peak, and the safety buffer stays the same size regardless of equity gained. You never build breathing room.
Why does a round-trip trade hurt more with trailing drawdown?
The failure point is usually a round-trip trade. You enter, the position moves $2,000 in your favour, then closes at breakeven. On a static account, you are exactly where you started. On a trailing account, your floor has permanently moved up by $2,000 and your headroom has shrunk by the same amount. The trade cost you nothing in profit but everything in margin. That asymmetry makes trailing drawdown feel punishing even when your strategy is working.
What Are the Three Types of Trailing Drawdown?
Not all trailing drawdowns work the same way. TradeZella's 2026 breakdown of trailing drawdown rules identifies three distinct variations: end-of-day, intraday, and locked-in. Each changes how you manage intraday profits, and knowing your specific type before your first funded trade is essential.
How does each trailing drawdown variation affect your strategy?
| Variation | How Floor Updates | Firm Examples | Strategy Impact | Risk Level | Key Adjustment |
|---|---|---|---|---|---|
| End-of-Day Trailing | Recalculates at session close based on highest closing balance | Topstep (evaluation) | Intraday peaks don't raise the floor. More room to hold through volatility. | Medium | End each day near the daily high |
| Intraday Trailing | Recalculates in real time at every new balance peak, including unrealized gains | Apex Trader Funding | Every unrealized peak raises the floor permanently. Letting winners run costs headroom. | High | Take 50% at first target, move stop to breakeven |
| Locked-In Trailing | Trails until floor reaches starting balance, then locks permanently | Topstep (funded) | Push to the lock-in point as fast as possible. Once locked, drawdown becomes static. | Low (after lock-in) | Prioritize reaching lock-in before sizing up or taking payouts |
End-of-day trailing drawdown
The floor adjusts only at the end of each trading day, based on your closing balance. Intraday peaks do not raise the floor. If your account opens at $50,000, spikes to $53,000 during the session, and closes at $51,000, the floor adjusts based on the $51,000 close, not the $53,000 peak.
How does end-of-day adjustment affect your floor in practice?
On a $50,000 account with a $2,500 trailing drawdown, your starting floor is $47,500. A strong morning pushes the account to $53,500 by noon; the afternoon reverses, and you close at $51,200. Your new floor is $48,700 (the $51,200 close minus $2,500). You can hold trades through normal intraday volatility without every unrealized tick permanently raising your floor. Topstep uses this approach on their Trading Combine evaluation accounts.
Intraday trailing drawdown
The floor adjusts in real time. Every new account high, including unrealized gains on open positions, raises the floor immediately and permanently. You can lose drawdown headroom on a trade that ultimately closes positive.
How does a single trade erode your safety margin?
A single trade illustrates why this matters. You enter a position, and it moves $1,500 in your favor. Your account briefly shows $51,500 before the floor immediately drops to $49,000. The trade pulls back and closes at plus $400 (account: $50,400). You started with $2,500 of headroom and now have $1,400. You made $400 in profit but lost $1,100 in safety margin. Every dollar of unrealized gain you surrender reduces your buffer against future losses while producing zero return. Apex Trader Funding operates this way: your floor moves with every tick of unrealized profit.
Why do automated strategies struggle with intraday trailing rules?
Most automated strategies are built to let winners run. That logic works on personal accounts and static drawdown accounts, but on an intraday trailing account it erodes your buffer every time a trade peaks and pulls back, even when closing green. Many traders running automated systems encounter this problem without recognizing the mechanism. Our trading VPS keeps systems connected and executing, but the strategy logic itself must account for how unrealized peaks interact with the floor before automation can help.
Locked-in trailing drawdown
The floor tracks your account until your balance reaches a lock-in threshold, then converts to a static drawdown anchored at your starting balance. The drawdown is most dangerous in the early phase and most forgiving after lock-in.
How does the lock-in threshold change the way you trade?
On a $50,000 account with a $2,500 trailing drawdown and a lock-in at $52,600, every new high raises the floor during the trailing phase. Once your end-of-day balance reaches $52,600, the drawdown locks at $50,000 permanently. You could then grow to $70,000, drop to $50,100, and remain compliant.
The first $2,600 of profit is the most stressful stretch you will trade. After lock-in, the pressure drops sharply, and you trade with the same freedom as a static drawdown account. Topstep funded accounts use this structure, making the lock-in threshold the single most important milestone on those accounts.
Knowing which variation your firm uses fundamentally changes whether your current strategy should trade on that account.
What Are the Math Traps That Catch Traders?
Three specific math traps catch traders who believe they understand trailing drawdown but have never tested their assumptions against actual numbers.
"The gap between thinking you understand trailing drawdown and actually stress-testing it with real numbers is where most funded accounts go to die." — Trading Risk Management Principle
💡 What This Section Covers: The three critical math traps explored below are not theoretical edge cases — they are the exact miscalculations that cause traders to breach accounts they believed were safely managed.
⚠️ Warning: If you have never manually calculated your trailing drawdown threshold against a live equity curve, there is a high probability you are already operating inside one of these traps right now.
| Math Trap | Core Misconception | Risk Level |
|---|---|---|
| Trap #1 | Assuming drawdown trails from entry, not peak equity | 🔴 High |
| Trap #2 | Confusing balance-based vs equity-based trailing calculations | 🔴 High |
| Trap #3 | Underestimating how open profits shift the trailing floor in real time | 🟠 Critical |

The "I finished green" trap
A trader reaches a peak of $53,000 on a $50,000 account with a $2,500 intraday trailing drawdown, gives back gains through the afternoon, and closes at $50,800. The P&L shows green. What it doesn't show: the trailing floor moved from $47,500 to $50,500 when that peak was registered. Closing at $50,800 leaves only $300 of headroom. One average losing trade the next morning ends the account entirely. The profit number told a story of success; the floor movement told a story of near-elimination.
Traders track account balance but not floor distance. On intraday trailing accounts, only floor distance determines survival. A green close with $300 of headroom is objectively more dangerous than a flat day with $2,500 of headroom.
The "profitable trade" trap
The second trap catches even experienced traders. A trade moves $1,200 in your favor, the floor rises by $1,200, then reverses and closes at plus $200. The account gained $200, but headroom lost $1,000. That trade had a positive risk-reward ratio by every traditional measure, yet consumed five times more safety margin than it returned in profit. On a personal account, this is a winner with a wide stop. On an intraday trailing account, it is a net negative on your survival math.
Why does headroom consumed matter as much as profit captured?
This requires a second calculation running alongside standard risk-reward analysis: headroom consumed versus profit captured. Any trade that gives back more than 50% of its peak unrealized gain burns your margin faster than it builds your balance. The math is unforgiving and indifferent to whether the trade closed green.
Most traders track peak unrealized gains in a spreadsheet alongside their P&L. Our QuantVPS keeps automated strategies executing without interruption, which matters because a connection drop can force a manual close at a worse price, widening the gap between peak gain and captured profit.
The "net zero week" trap
The third trap hides inside a profitable week. Five trading days, net result plus $1,800, and yet the account is in violation. The reason is cumulative intraday peak erosion: each day's intraday high moves the floor, regardless of where the day closes. Add up the daily intraday peaks across five days and the floor may have moved $5,000 while the account only moved $1,800. The $3,200 difference is invisible in any standard P&L report.
Stay online and closer to execution. Choose a VPS location for CME futures, New York markets, London FX, API trading, and more.
Host your platform near the market route that matters.
CHINYCLONFrom $29.99/mo
CHI/CME futuresNYC/US marketsLON/FX EAsDUB/PolymarketAMS/EU FXFRA/Central EUTYO/APAC cryptoWhy does a profitable week still trigger a drawdown breach?
How you recover from a trailing drawdown differs from recovering money in a personal account. In a personal account, a profitable week is a win. In an intraday trailing account, you must track a different metric: how much of your available capital you used compared to the profit you generated during the week. You can profit for five consecutive days and still hit your drawdown limit by Friday's close.
Knowing these traps exist is one thing; changing how you trade because of them is another.
How Should You Trade Differently Under Trailing Drawdown?
Trailing drawdown changes how you manage trades from entry to exit: not just your risk parameters.
💡 Tip: Think of trailing drawdown as a dynamic constraint that reshapes every decision once you're in a position, from scaling in to knowing when to exit.
"Trailing drawdown doesn't just limit your losses — it redefines the entire framework of trade management from entry." — Core Prop Trading Principle

The six adjustments below apply most sharply to intraday trailing accounts, where every unrealized peak permanently shifts your floor. End-of-day trailing accounts are more forgiving because intraday spikes do not count — but the underlying discipline is the same: headroom is a finite resource, and every decision either preserves it or wastes it.
⚠️ Warning: Many traders underestimate how quickly intraday unrealized gains can raise their trailing floor — locking in a tighter buffer even if they never book the profit.
🎯 Key Point: Regardless of account type, treat available headroom as your most valuable trading asset — once it's gone, so is your account.
| Account Type | Intraday Spikes Count? | Headroom Risk Level | Discipline Required |
|---|---|---|---|
| Intraday Trailing | ✅ Yes — every peak counts | 🔴 High | Maximum |
| End-of-Day Trailing | ❌ No — only closed equity | 🟡 Moderate | High |
The Six Adjustments That Actually Matter
Adjustment 1: Take profits earlier. On an intraday trailing account, holding for a 3R target while giving back 1.5R of unrealized gains costs more headroom than the profit justifies. Take 50% of your position off at 1R profit and move the stop to breakeven on the remainder. This guarantees you capture at least half the gain and limits damage from reversal. Headroom, not account size, is your binding constraint.
Adjustment 2: Enter full size at the initial entry. Scaling into winners amplifies the round-trip problem. If you add at plus $800 unrealized and the trade reverses from plus $1,200 to plus $400, you surrender $800 on a larger position while the floor has already moved to the peak. On intraday trailing accounts, scaling into winners destroys headroom rather than growing it.
Adjustment 3: End days near your daily high. A strong morning followed by a weak afternoon is more damaging than the P&L suggests, since the floor adjusts to your close and afternoon losses eat into headroom without recovering the morning's gains. If you are up $1,000 by late morning, stopping for the day is often correct. Build a "profit protection stop" into your daily protocol: a specific dollar gain at which you end the session.
Adjustment 4: Track headroom in real time, before every trade. Know your current headroom to the dollar before entering. Research from Man Group Insights confirms that trailing drawdown constraints directly affect position sizing as your cushion shrinks. If your headroom is $800 and you risk $500 on a single trade, you are betting 62.5% of your remaining safety margin on one outcome—a judgment problem.
Adjustment 5: Push to lock in fast on locked-in trailing accounts. The pre-lock-in phase is the most dangerous window: every unrealized gain you give back erodes headroom without moving you closer to the lock-in threshold. Trade your highest-probability setups only during this phase and accept smaller, consistent gains over big swings. Once you lock in, the trailing mechanism stops, and you can expand to your full playbook with significantly less pressure.
Adjustment 6: Scale position size with remaining headroom, not starting headroom. Never risk more than 20% of your remaining headroom on a single trade. If you started with $2,500 headroom and now have $1,000 left, your maximum risk per trade is $200, not $500. Robeco's quant research uses a 10% trailing drawdown threshold to reduce portfolio risk exposure, reflecting the same logic: a shrinking cushion demands shrinking bets. If headroom drops below 30% of the original trailing amount, stop trading that account for the day.
What Does the Daily Tracking Workflow Look Like?
The workflow takes about 15 minutes per day, split across three checkpoints.
Before the session (5 minutes): confirm your current balance, floor, and headroom for each funded account. Calculate your maximum position size using 20% of remaining headroom. If any account falls below 40% of the original trail, it enters protection mode: trade at minimum size or not at all.
During the session, monitor headroom in real time. After any trade that moves your account to a new high, recalculate headroom before the next entry. If headroom drops below your threshold, stop trading that account for the day. Most traders who blow trailing accounts do not blow them on one bad trade; they blow them across three or four trades after headroom was already critically low.
Most traders managing multiple funded accounts track performance manually, creating lag between account activity and awareness. Platforms like QuantVPS support always-on, low-latency trading environments with real-time dashboard monitoring, closing the gap between a new account high and your awareness to seconds rather than minutes.
After the session (5 minutes): record your end-of-day balance, new floor, and remaining headroom. Calculate the "peak vs. close" gap—the difference between the intraday peak and closing balance. That number is your daily headroom waste. If you consistently give back more than 30% of your intraday peaks, your profit-taking is too late. Track this weekly; it reveals more about your funded account performance than your win rate.
The weekly review (15 minutes) reveals the pattern. Compare total headroom consumed to total profit captured across the week. If headroom consumption significantly exceeds profit, you are experiencing the classic trap: trading frequently, generating unrealized gains, then watching the floor absorb them. The fix is earlier profit-taking and fewer trades per session, applied consistently until the ratio improves.
Knowing all six adjustments and running the daily workflow leaves one critical question: what happens when the infrastructure you rely on to execute these decisions introduces latency at exactly the wrong moment?
Understanding Intraday vs End of Day Trailing Drawdown #futurestrading #propfirms #propfirmtrader
Using Trading VPS to Stay Within Drawdown Limits
When it comes to managing trailing drawdown limits, precise risk management is non-negotiable. And in this context, having a reliable technical setup can make all the difference.
Why VPS Helps Your Trading
Staying within drawdown limits requires a trading environment that delivers speed, reliability, and consistency. This is where a Virtual Private Server (VPS) steps in. A VPS ensures that your trading platform remains operational even if your home internet goes down or your computer crashes. This stability is critical, especially when you're close to your drawdown threshold and need to execute protective trades without delay.
Speed is another big advantage. Hosting your trading software on a VPS near your broker's servers can significantly cut down latency. Some VPS solutions boast latencies as low as 0.30ms, giving you a crucial edge to close positions quickly and avoid breaching drawdown limits. Unlike shared hosting, a VPS offers an isolated environment, ensuring that your trading performance isn’t affected by other users’ activities - a key benefit for accounts that rely on precise risk management.
Better Drawdown Control with VPS
Local technical issues like power outages or internet disruptions can wreak havoc on your trading strategy, potentially pushing you past your drawdown limits. A VPS minimizes these risks by keeping your trading systems running 24/7. This ensures that automated strategies, stop-loss orders, and other risk management tools remain active even if your local setup fails.
Lower latency also helps you reduce slippage, increasing the chances of executing trades at your desired price levels. Plus, professional VPS services often come with advanced security features to protect your trading data from cyber threats. For the best results, choose a VPS provider with servers located close to your broker’s infrastructure to reduce latency. Look for uptime guarantees of at least 99.9% to ensure uninterrupted trading.
These advantages create a solid foundation for advanced risk management tools like those offered by QuantVPS.
QuantVPS Features for Risk Management
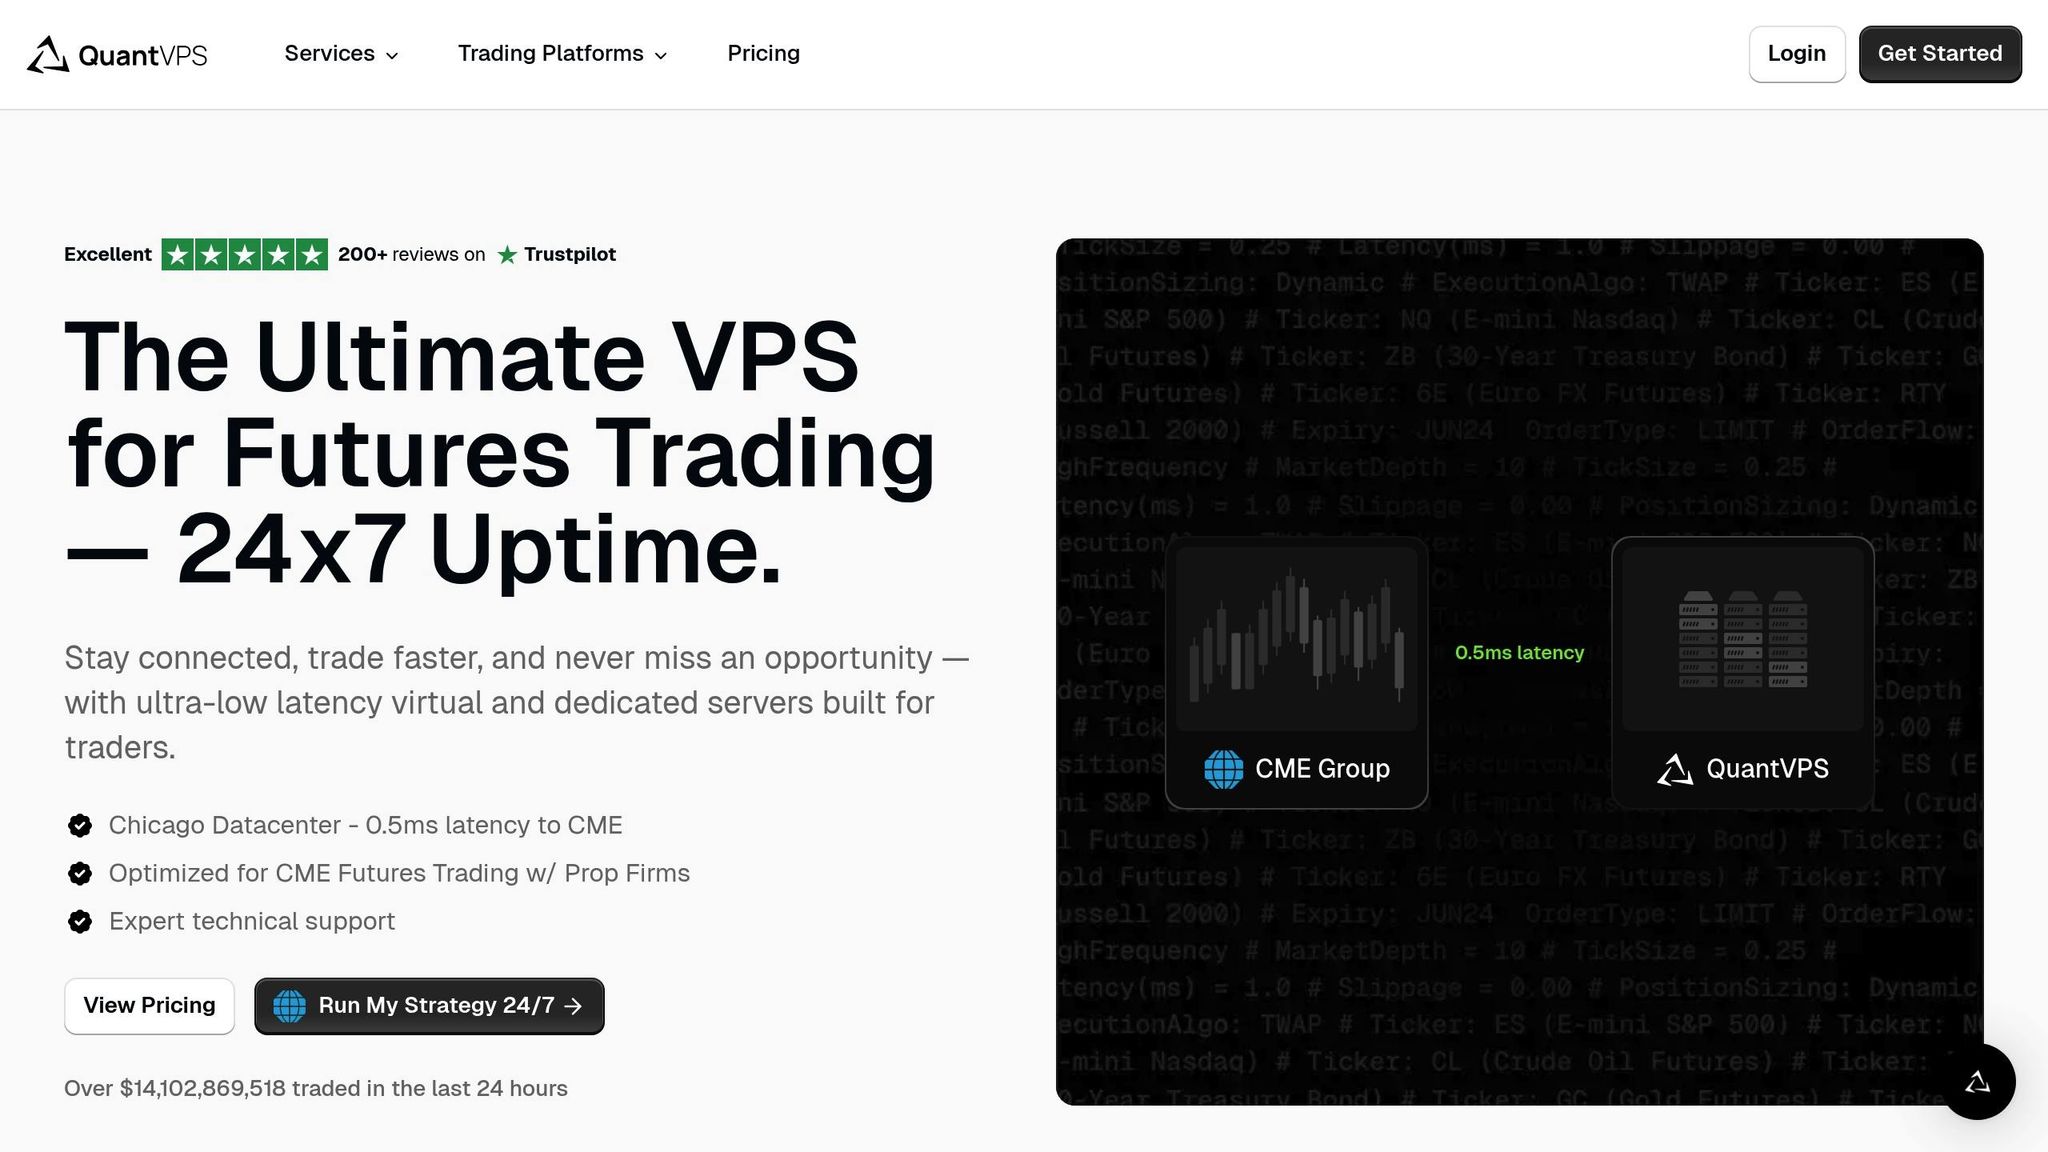
QuantVPS takes trading reliability to the next level with features specifically tailored for managing trailing drawdown limits. It offers ultra-low latency (0–1ms), 100% uptime, automatic backups, and robust security measures like DDoS protection and advanced firewalls. Compatible with platforms such as NinjaTrader, MetaTrader, and TradeStation, QuantVPS ensures smooth and efficient risk management.
Whether you’re trading high-frequency equities (under 100ms), forex (100–300ms), or retail stocks (100–300ms), QuantVPS provides the performance needed to stay within acceptable latency thresholds. High-performance CPUs and NVMe storage further enhance your ability to make quick, informed decisions when managing exposure relative to your drawdown limits.
With a variety of plans available, QuantVPS ensures you have the tools and resources required to maintain effective risk control tailored to your trading needs.
Conclusion
Main Points to Remember
Trailing drawdown is a flexible risk management tool designed to safeguard funded trading accounts while promoting disciplined trading habits. The way it's calculated can differ greatly depending on the account type and the provider. For instance, End-of-Day (EOD) trailing drawdown adjusts at the close of the market, while intraday trailing drawdown updates in real-time during trading hours. Some firms halt the trailing mechanism once you hit profit targets, but others may continue trailing indefinitely. Knowing these differences is critical because exceeding your trailing drawdown limit results in immediate account termination.
Managing this effectively requires constant oversight and a disciplined approach. This includes regularly tracking your drawdown levels via your trading platform and sticking to a trading plan that emphasizes protecting your capital [15]. While it can be mentally taxing to trade with a moving stop-loss, this practice fosters stronger risk management skills over time.
A reliable technical setup is equally important for staying within drawdown limits. A stable trading environment reduces the risk of execution delays or system glitches, especially during volatile market conditions. Features like ultra-low latency and 24/7 system uptime are vital for maintaining control and avoiding unnecessary breaches.
What to Do Next
To refine your trading strategy and work effectively within trailing drawdown limits, consider these actionable steps:
- Understand your firm's rules: Review the trailing drawdown policies of your proprietary trading firm and set up real-time monitoring tools within your trading platform. Since each provider applies these rules differently, tailor your approach to fit their specific requirements. Documenting your plan can also help you stay grounded during emotionally charged trading sessions.
- Leave room for the unexpected: Maintain a buffer in your account balance to handle potential slippage or overnight gaps that could unexpectedly push you past your drawdown threshold.
- Upgrade your trading setup: Reliable technology is essential for managing risk under tight drawdown constraints. Services like QuantVPS offer ultra-low latency (0-1ms), 100% uptime, and compatibility with popular platforms like NinjaTrader, MetaTrader, and TradeStation. Starting at $59/month for the VPS Lite plan, these solutions provide the speed and stability needed for precise execution. Many traders, especially those using expert advisors or engaging in high-frequency forex trading, report fewer losses after switching to VPS systems.
- Focus on sustainable strategies: Prioritize long-term profitability over short-term gains. The aim is not to win every trade but to grow your account steadily while preserving your capital.
FAQs
What is the difference between trailing drawdown and static drawdown, and how do they affect trading and mindset?
Trailing Drawdown vs. Static Drawdown
Trailing drawdown and static drawdown are two risk management tools that play a big role in shaping trading strategies and influencing a trader's mindset.
A trailing drawdown adjusts dynamically based on your account's highest balance. This means as your account grows, the drawdown limit moves up with it. This approach not only protects your profits but also gives you the flexibility to take calculated risks. It’s a setup that encourages growth while boosting confidence in your trading decisions.
On the other hand, a static drawdown stays fixed, no matter how well your account performs. While this can promote discipline by setting a clear limit, it might also make traders overly cautious. The fear of hitting that unchanging threshold can sometimes hold traders back from making bold, yet informed, moves.
Knowing the difference between these two methods can help you fine-tune your trading strategy and ensure your risk tolerance aligns with your trading objectives.
What are common mistakes traders make with trailing drawdown, and how can they avoid them?
One mistake traders often make with trailing drawdown is misunderstanding how it works. Many believe it’s calculated based solely on closed trades, but it actually factors in the highest account balance reached, including unrealized profits. In other words, as your profits grow, the drawdown threshold moves up - but it doesn’t adjust downward if you incur losses. Misunderstanding this can catch traders off guard and even lead to unexpected account suspensions.
To steer clear of these pitfalls, take time to fully understand the rules your trading firm has in place for trailing drawdown. Regularly monitor your account balance and pay close attention to how profits influence your drawdown limit. By aligning your trade planning with this knowledge and implementing strong risk management strategies, you’ll be better positioned to stay within the limits and enhance your trading performance.
How does using a Virtual Private Server (VPS) help manage trailing drawdown limits in trading?
A Virtual Private Server (VPS) provides traders with a reliable, high-speed platform to manage trailing drawdown limits effectively. By offering faster trade execution and lower latency, a VPS reduces the chances of slippage during unpredictable market swings, ensuring trades are carried out accurately and within the defined risk parameters.
On top of that, a VPS is ideal for running automated trading systems that can enforce preset rules, including trailing drawdown limits. This automation removes the influence of emotions from trading decisions, helping traders stick to their risk management strategies consistently - an essential factor for achieving sustainable success in the markets.