Imagine spending months developing a trading strategy, only to watch it fail when real money is on the line. That gap between a promising idea and a proven system is where most traders struggle, usually because they skipped backtesting against historical data. This guide explains how quantitative trading strategies work, how backtesting measures performance before you commit capital, and how to build a data-driven process that gives you genuine confidence in your decisions.
Running automated trading systems and backtesting models requires a stable, always-on environment where algorithms execute without interruption. Our QuantVPS trading VPS keeps your strategy running 24/7, reduces execution delays, and provides a reliable foundation for your quantitative models, signal generation, and order execution—whether refining risk parameters or deploying a fully tested system.
Summary
- Backtesting failure is more common and more costly than most traders expect. Transaction costs and slippage alone can erode 20 to 50 percent of backtested returns when a strategy moves into live trading, meaning a strategy that looked profitable on paper may never have had a real edge to begin with. The gap between a promising backtest and a durable live strategy is where most quantitative traders lose money.
- Overfitting is the most persistent threat in quantitative research. Work by Marcos López de Prado and David H. Bailey on the Deflated Sharpe Ratio shows that as the number of strategy trials increases, the expected maximum Sharpe Ratio from pure noise rises in a predictable pattern. A researcher who tests 200 parameter combinations and reports the best result is not reporting a discovery but the highest false positive from a large random draw.
- The scale of backtest failure across published research is striking. A study analyzing 890 backtests across 18 published trading rules returned a median validation score of 3.7 out of 100 using a multi-factor framework. More than half of those published rules could not cover transaction costs before any question of statistical overfitting became relevant, meaning the failure was arithmetic, not sophisticated.
- Out-of-sample testing is the most structurally important safeguard in the validation process, yet it is frequently compressed or skipped. Research from TradersPost indicates that out-of-sample testing should use at least 20 to 30 percent of total historical data to validate strategy robustness. The moment a researcher adjusts parameters in response to out-of-sample results, that data becomes in-sample and the one honest test has been spent.
- Monte Carlo analysis and parameter sensitivity testing are what separate a single fragile result from a confidence distribution. A strategy should be tested on at least 200 to 300 trades to be considered statistically significant, and shifting key parameters by 10 to 20 percent in both directions reveals whether profitability depends on one exact setting or survives a reasonable range of values. Strategies that collapse under small parameter changes are overfit, regardless of how strong the in-sample curve looks.
- Over 70 percent of trades in US equity markets are now executed by algorithmic systems, which means the competition for any quantitative edge is not retail traders with spreadsheets but institutional quant desks running the same falsification checks described here. A trading VPS addresses this by providing the low-latency, always-on infrastructure that validated strategies require to execute as designed once they move from backtesting into live markets.
What Are Quantitative Trading Strategies and Why Does Backtesting Matter?
Quantitative trading strategies are systematic, rules-based approaches where every decision is encoded in mathematical logic and executed by algorithms. The strategy follows a precise set of conditions derived from historical data, signal generation models, and risk parameters, then fires orders automatically when those conditions are met.
| Component | What It Does |
|---|---|
| Historical Data | Provides the raw foundation for pattern discovery and model training |
| Signal Generation Models | Identifies entry and exit triggers based on mathematical conditions |
| Risk Parameters | Controls position sizing, drawdown limits, and exposure rules |
| Execution Algorithms | Fires orders automatically when all conditions are satisfied |
💡 Key Concept: A quantitative strategy is only as reliable as the quality of its underlying data and the precision of its rules — vague logic produces unpredictable results.

"The gap between strong backtest returns and live market performance is one of the most expensive lessons a trader can learn." — A hard truth across quantitative finance
Many traders assume that strong backtest returns indicate a strategy will work in live markets. That assumption is wrong, and the gap between believing it and learning it the hard way is expensive.
⚠️ Critical Warning: Backtesting is not proof of future profitability — it is a hypothesis-testing tool. Overfitting, look-ahead bias, and unrealistic execution assumptions are the most common reasons a strategy that looks great on paper fails in production.
🎯 Key Takeaway: The real purpose of backtesting is to eliminate bad strategies cheaply — not to guarantee winners. Treat every backtest result as a starting point for scrutiny, never a finish line.
Why does a profitable backtest fail to predict live trading results?
A profitable backtest proves only that a particular set of rules applied to a particular slice of historical data produced a particular result—not that it will work tomorrow. Historical data contains survivorship bias, look-ahead bias, data-snooping (testing so many variations that something eventually fits by chance), and execution assumptions that bear no resemblance to live conditions. According to Quantitative Finance Stack Exchange, transaction costs and slippage alone can erode 20 to 50 percent of backtested returns in live trading. The model memorized a historical artifact, not a market truth.
How does overfitting manufacture false performance in backtesting?
Marcos López de Prado, author of "Advances in Financial Machine Learning," has written extensively about backtest overfitting and the multiple testing problem. His work with David H. Bailey on the Deflated Sharpe Ratio (2014) demonstrates how performance gains stem from running excessive trials on the same dataset. A researcher who tests 200 parameter combinations and reports the best result is reporting the highest false positive from a large random draw, not a genuine discovery.
A study analyzing 890 backtests across 18 published trading rules at their original parameters achieved a median score of 3.7 out of 100 using a multi-factor validation framework. More than half could not cover transaction costs. Those rules were published, cited, and traded by people who trusted the backtest.
What does credible backtesting actually require you to prove?
The question is not whether you can find a strategy that wins in historical data, but whether you can design a test that gives credible reason to believe those results survive outside the sample. QuantInsti's backtesting research notes that over 70 percent of trades in US equity markets are executed by algorithmic systems, meaning you compete against institutional quant desks already running the falsification checks you are only now learning exist.
The components that make a strategy testable
A quantitative trading strategy has five core parts that must work together before backtesting means anything. Clean historical data (price series, fundamental data, or alternative data) forms the foundation; errors here spread through every calculation downstream. Signal generation turns available information into buy, sell, or hold decisions using only data that existed at each specific moment.
Position management converts signals into actual portfolio allocations, handling sizing, rebalancing, and constraints. Execution simulation models fill, slippage, and market impact so the gap between theoretical and realistic outcomes is visible. Performance tracking records portfolio values and returns to support rigorous statistical analysis. Most backtests that fail in live markets cut corners in at least two of these five areas, typically execution simulation and signal generation.
What separates a credible backtest from a historical coincidence?
The question is whether you can design a test that gives you a believable reason to think those results will work outside the sample. That difference separates traders who build real systematic edges from those who build complicated historical coincidences.

Run 24/7 while you sleep. Keep bots, platforms, and trade copiers online on a dedicated VPS.
Low-latency VPS hosting for your trading platform.
 CHINYC
 LON
LONFrom $59.99/mo


 CHI/CME futuresNYC/US marketsLON/FX EAs
 DUB/Polymarket
 AMS/EU FX
 FRA/Central EU
 TYO/APAC crypto
But even a strategy that passes every statistical test faces a challenge most quant traders underestimate.
What Are the Most Common Quantitative Trading Strategies to Backtest?
The strategy type is never the edge. The edge lives inside a specific, testable hypothesis about why a market behaves a certain way, and whether that behavior survives realistic costs, out-of-sample data, and regime shifts. Every strategy family below shares the same structure: assumption, signal, entry and exit logic, source of edge, and the exact condition that breaks the backtest.
"The edge lives inside a specific, testable hypothesis about why a market behaves a certain way — and whether that behavior survives realistic costs, out-of-sample data, and regime shifts."
| Strategy Component | What It Defines |
|---|---|
| Assumption | The core belief about market behavior |
| Signal | The measurable trigger for action |
| Entry & Exit Logic | The precise rules for opening and closing positions |
| Source of Edge | Why the strategy should work |
| Backtest Breaker | The condition that exposes the strategy as flawed |
💡 Key Insight: Every quantitative strategy — no matter how complex — can be reduced to these five components. If you cannot define all five, your hypothesis is not ready to backtest.
⚠️ Warning: Confusing a strategy type with an actual edge is one of the most common and costly mistakes in quantitative trading. A label like "mean reversion" or "momentum" is not a strategy — it's a category. The real work begins when you define the specific conditions that make it profitable.
 1. Mean Reversion
PyQuant News notes that mean reversion strategies typically use z-scores with thresholds of ±2 standard deviations to signal trades. These strategies assume prices drifting far from their historical average will revert to it. The algorithm monitors a moving average, Bollinger Band, or z-score, entering a trade when price breaks through the threshold and exiting when it returns to normal. A stop-loss order sits outside the band to limit risk from extreme price swings.
Where does the mean reversion edge come from, and when does it break down?
The advantage comes from predictable behavior in range-bound instruments, particularly high-liquidity equity pairs and certain Forex crosses with low directional news flow. But this advantage disappears when the underlying relationship changes structurally. A stock range-bound for three years can trend for eighteen months straight, and a mean reversion model will lose money throughout. Volatility filters that pause the strategy during trend-heavy regimes are essential—they keep the hypothesis honest.
2. Momentum Trading
The market assumption here is the opposite: recent return differences persist because of behavioral underreaction and institutional flows that take time to fully price new information. According to PyQuant News, momentum strategies look back 3 to 12 months of historical returns to rank and select assets, going long the top decile and short the bottom, with monthly rebalancing to rotate into fresh leaders. Jegadeesh and Titman documented this cross-sectional momentum effect in U.S. equities in 1993, and Moskowitz, Ooi, and Pedersen extended the finding to time-series momentum across asset classes in 2012.
How do regime shifts and implementation costs affect momentum results?
How well momentum strategies work depends on what you're investing in, your holding period, trading costs, and market conditions. A strategy that works well in one period can fail when market conditions shift—such as when cryptocurrencies reverse direction or stocks drop sharply. Using both a trailing stop and a time stop together is essential to how the strategy functions, not merely a risk management add-on.
3. Statistical Arbitrage and Pairs Trading
Statistical arbitrage exploits temporary price differences in related financial instruments by trading when the spread between them deviates from normal levels, measured using z-score breaches. The algorithm buys the cheaper instrument, sells the more expensive one, and profits when the price difference reverts to normal. Understanding the time required for a spread to normalize is critical: if a spread takes sixty days to revert but you exit after twenty days, you will lose money instead of profiting from the signal.
Why does cost blindness cause most stat-arb backtests to fail?
The most common backtest failure in stat-arb is cost blindness. Many tested implementations cannot cover their own trading costs before any statistical test is applied. If the expected reversion magnitude is smaller than the round-trip cost of entering and exiting both legs, no optimization rescues the strategy. Model costs first, then test the signal.
4. Algorithmic Pattern Recognition
The market assumption is that large institutional orders leave detectable footprints in order flow data: unusual volume clusters, iceberg orders, and quote imbalances preceding price breakouts. The algorithm is trained on labeled historical data, then deployed to flag these patterns in real time and join the institutional flow ahead of the move. Latency matters enormously; co-located servers are a structural requirement for the edge to exist.
Why do most pattern-recognition backtests fail to hold up?
The risk of being wrong is serious. Models trained on past order flow assume that institutional behavior predicts future price movement. However, Monte Carlo permutation testing on synthetic price histories shows the median result collapses toward zero. This means most pattern-recognition backtests fit noise, not signal. Without a prior causal hypothesis about why the pattern should persist, greater model complexity increases degrees of freedom available for self-deception.
5. Trend Following
Trend following assumes prices show steady directional momentum across different types of investments because information spreads slowly and large systematic funds behave predictably. The signal is a moving-average crossover, ATR filter, or channel breakout. Long entries occur above the channel high; shorts below the channel low. Stops trail at a fixed ATR multiple, accepting frequent small losses to capture occasional large directional moves.
Why does regime concentration invalidate trend following backtests?
Backtests are most often invalidated by regime concentration, not parameter choice. The same trend-following rule scores dramatically differently across date windows depending on whether one strong trend year is included. Diversification across uncorrelated assets and timeframes is the only structural defense: it prevents the entire strategy from depending on one regime rather than improving returns within any single regime.
6. Machine Learning Models
Machine learning models assume that complex nonlinear relationships in large datasets contain predictive signal that linear models miss. Entry and exit are governed by model outputs trained on labeled historical features, ranging from price and volume to order flow and sentiment. These models identify variable interactions no human researcher would test. Yet that flexibility carries primary risk: more parameters mean more ways to fit the past without predicting the future.
What separates genuine edge from sophisticated noise in machine learning models?
The critical difference between a machine learning model that adds real value and one that adds sophisticated noise is the presence of a prior causal hypothesis. If you cannot explain why a feature should predict price movement before training the model, the model will find a spurious pattern in the data that won't generalize. A single test set is insufficient. The more rigorous check is a Monte Carlo permutation framework that runs the full training and evaluation pipeline on synthetic price histories, comparing the real result against the distribution of results on data containing no signal by construction. If the real model does not clearly outperform its synthetic counterparts, the hypothesis has been illustrated, not tested.
Once you've chosen a strategy hypothesis, the next challenge is proving the apparent edge isn't simply a product of the historical data used to discover it—the point where most traders discover whether they were testing a strategy or telling themselves a convincing story.
How to Backtest a Quantitative Trading Strategy Without Fooling Yourself
The biggest backtesting mistake isn't using the wrong strategy. It's building a test that makes an average strategy look amazing.
"The goal of backtesting is not to prove your strategy works: it's to actively try to prove it doesn't." — Quantitative Trading Principle
⚠️ Warning: If your equity curve looks too clean, too consistent, or too profitable, that's not a green light. It's a red flag that your test may be flattering a flawed strategy.
 The mechanics of a backtest are easy to get right on the surface: load price data, apply your rules, and watch the equity curve go up. What's harder is building a test that actively tries to break your strategy rather than confirm it. Every step in the validation chain exists to prevent a specific failure — skip one, and you've introduced a critical blind spot.
💡 Tip: Treat every stage of your backtesting process as a deliberate stress test, not a formality. The steps aren't bureaucratic checkboxes — they're your last line of defense against self-deception.
| Validation Step | Failure It Prevents |
|---|---|
| Out-of-sample testing | Overfitting to historical noise |
| Transaction cost modeling | Unrealistic profit assumptions |
| Look-ahead bias checks | Using future data illegally |
| Walk-forward analysis | Strategy fragility over time |
🎯 Key Point: A rigorous backtest isn't about making your strategy look good — it's about ensuring that when it does look good, you can actually trust the result.
Why should you start with a hypothesis, not a pattern?
The failure point is usually here: a trader finds a pattern in historical data, then builds a backtest to confirm it. That sequence is backward. A proper backtest begins with a hypothesis grounded in a structural or behavioral market mechanism—for example, "stocks with accelerating earnings revisions outperform over a 3-month horizon because institutional capital rotates toward improving fundamentals." The hypothesis defines what you're testing before you examine the data. Without it, you're conducting an archaeological dig and labeling whatever you find a discovery.
Why does clean historical data matter so much for your backtest?
Once the hypothesis exists, clean historical data becomes the first line of defense against false signals. Adjusted price series that account for splits and dividends, point-in-time fundamental data reflecting what was actually known on a given date, and verified corporate action records are non-negotiable. Bad data manufactures edges that never existed, and no amount of sophisticated modeling recovers from a corrupted foundation.
Stay online and closer to execution. Choose a VPS location for CME futures, New York markets, London FX, API trading, and more.
Host your platform near the market route that matters.
CHINYCLONFrom $59.99/mo
CHI/CME futuresNYC/US marketsLON/FX EAsDUB/PolymarketAMS/EU FXFRA/Central EUTYO/APAC cryptoThe in-sample and out-of-sample split is non-negotiable
In-sample data helps develop and adjust the strategy. Out-of-sample data, kept separate during development, tests it. The moment you change parameters based on out-of-sample results, that data becomes in-sample: you've used your one honest test.
What biases silently inflate backtesting performance?
QuantStart's backtesting research identifies four major biases that inflate backtesting performance: Optimization Bias, Look-Ahead Bias, Survivorship Bias, and Psychological Tolerance Bias. Look-ahead bias occurs when signal calculations use information unavailable at trade time. Point-in-time earnings data reported with a 45-day lag cannot feed a signal firing on announcement date. If it does, the backtest measures clairvoyance, not strategy.
How do transaction costs and slippage kill a theoretical edge?
Transaction costs and slippage are where theoretical edges die. If a strategy's backtested edge disappears after realistic commissions and slippage, the strategy's gross signal was too weak to survive implementation. A mean reversion strategy trading illiquid small-caps at 20 basis points of gross edge per trade does not survive 15 basis point round-trip costs. The model costs conservatively, uses bid-ask spread estimates calibrated to actual market conditions, and applies volume constraints that prevent the backtest from assuming fills the real order book would never provide.
Risk-adjusted metrics reveal what raw returns hide
Evaluation requires more than CAGR. Maximum drawdown reveals the worst peak-to-trough loss, determining whether a trader would abandon the strategy before recovery. The Sharpe ratio measures excess return per unit of total volatility but penalizes upside and downside equally. The Sortino ratio corrects this by measuring excess return against downside deviation only, making it more appropriate for positively skewed return distributions. The Calmar ratio divides annualized return by maximum drawdown, showing how much return the strategy generates per unit of worst observed risk.
Win rate alone tells you almost nothing—a strategy can win 70% of trades and still destroy capital if average losses are three times average gains. These metrics form a stress test, not a scorecard. A backtest is not proof of profitability but a test of whether the strategy's hypothesis survives increasingly realistic challenges.
How does walk-forward testing expose parameter fragility?
Walk-forward testing addresses parameter fragility: a strategy optimized on a single window may have found parameters that fit that specific time period rather than a durable market relationship. Walk-forward testing rolls the optimization window forward in time, re-optimizes on each new in-sample period, and tests on the immediately following out-of-sample window. If parameters shift dramatically between windows, the strategy lacks robustness. According to QuantStart, backtesting biases inflate performance in nearly 100% of cases, making every backtest result an optimistic ceiling rather than a realistic floor.
But knowing a strategy passed those challenges in historical data leaves one critical question unanswered: whether you trade it.
How to Know if Your Backtested Strategy Is Robust Enough to Trade
A backtest that passes in-sample tells you the strategy has a pulse — but not whether it has a spine.
"A backtest that passes in-sample tells you the strategy has a pulse — but not whether it has a spine." — Core Principle of Robust Strategy Validation
🎯 Key Point: In-sample performance is only the beginning of validating a strategy — a passing backtest is a necessary condition, but never a sufficient one.
⚠️ Warning: Traders who stop at in-sample results are most vulnerable to curve-fitting, overfitting, and catastrophic live drawdowns when market conditions shift.
| Validation Stage | What It Tells You | What It Doesn't Tell You |
|---|---|---|
| In-Sample Backtest | Strategy has historical fit | Whether it generalizes to new data |
| Out-of-Sample Test | Early robustness signal | Whether it survives real execution |
| Walk-Forward Analysis | Adaptive consistency over time | Live slippage and liquidity impact |
| Live Paper Trading | Real-time behavior validation | Actual psychological execution under pressure |
💡 Tip: Always treat your in-sample backtest as a starting hypothesis — then stress-test it with out-of-sample data, parameter sensitivity checks, and Monte Carlo simulations before committing real capital.
 The robustness checklist, test by test
Work through these in order. Each one narrows the gap between what your backtest shows and what live trading will deliver.
Out-of-sample testing
Set aside a portion of your data before running any optimization. According to the TradersPost Blog, out-of-sample testing should use at least 20 to 30 percent of total historical data to verify your strategy's performance. This reveals whether the strategy's logic works beyond the period used to build it. If out-of-sample performance deteriorates, the idea was never sound: revisit the underlying market mechanism, not the parameters.
Walk-forward validation
Fit your parameters on a rolling in-sample window, trade the next unseen period without refitting, then roll forward. This reveals whether the strategy adapts across time or only works when rules are tuned to the full history. Failure here is a hard stop. A strategy that needs to see the future to perform is not a strategy; it is a description of the past dressed up as a forecast.
Sensitivity analysis
Change your key numbers up and down by 10 to 20 percent to see how your strategy performs. This reveals whether profits depend on exact settings or hold up when values shift. A strategy that wins 90 percent of the time in backtesting but fails when a single threshold moves by a few ticks is overfit. If small changes destroy your returns, simplify the logic or revisit your core idea.
Multiple market regimes and realistic costs
Test across bull markets, bear markets, and sideways periods separately, then apply realistic transaction costs, bid-ask spreads, and slippage. This reveals whether the edge is structural or arises from one favorable environment. Mean-reversion strategies calibrated to low-volatility regimes collapsed after 2008 when volatility spiked, and spreads widened. If results deteriorate after costs, the strategy was never profitable.
Monte Carlo and parameter stability analysis
Resample your trade sequence randomly across hundreds of simulations to stress-test the equity curve. Tradeciety's Ultimate Guide to Backtesting notes that a strategy should be tested on at least 200 to 300 trades to be considered statistically significant. Monte Carlo analysis converts that sample into a confidence distribution rather than a single fragile result, revealing whether your returns reflect chance or a repeatable edge. If the worst-case Monte Carlo drawdown exceeds your risk tolerance, you have identified a critical issue before risking real capital.
What does a green flag look like in a validated strategy?
Green flags mean performance sustains with new data, results withstand realistic costs, returns span multiple periods rather than concentrating in one narrow window, profitability holds across reasonable parameter changes, and drawdowns remain within your tolerance threshold. Every one of these must be present, not most of them.
Which red flags are enough to stop and rebuild from scratch?
Red flags include: most profits come from one short window, tiny parameter changes destroy returns, results collapse after costs, the strategy depends on information unavailable at trade time, or in-sample performance dramatically exceeds out-of-sample results. Any single red flag warrants stopping and rebuilding from the hypothesis up.
Why is paper trading before live deployment non-negotiable?
Paper trading before live deployment is not optional. Run the strategy in real market conditions with real order flow, real latency, and real slippage for at least one full market cycle before committing capital.
A strategy that clears every test on this checklist still makes no guarantees. One that fails any of them will cost you money in ways the backtest never showed you.
What happens when the infrastructure running your strategy can't keep up with the market it was built to trade?
Your Backtest Passed. Can Your Trading Infrastructure Keep Up?
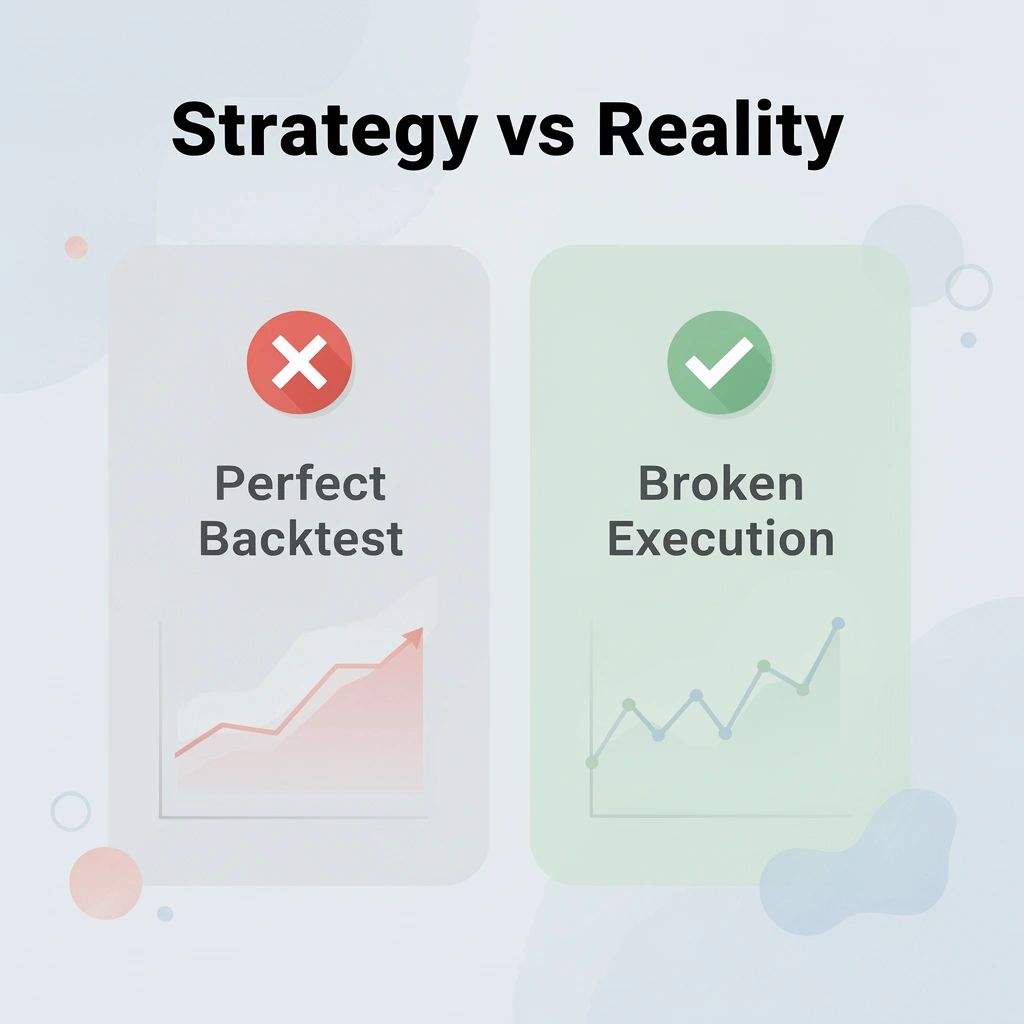
Passing every robustness test is a milestone. But a validated strategy on unreliable infrastructure is like a race car tuned to perfection then handed to a driver with no road. The edge you built in testing disappears when execution lags, platforms restart mid-session, or connectivity drops at the wrong moment.
"The edge you built in testing disappears when execution lags, platforms restart mid-session, or connectivity drops at the wrong moment."
⚠️ Warning: Even a perfectly backtested strategy can fail in live markets if your infrastructure isn't built to match. Execution quality is as critical as signal quality.
 Our trading VPS from QuantVPS solves this with a stable, always-on environment built specifically for automated trading. Here's what's included:
| Feature | What It Means for You |
|---|---|
| 1 ms ultra-low latency | Orders execute before the market moves away |
| 100% uptime guarantee | No mid-session restarts killing your positions |
| 24/7 support | Help available whenever markets are open |
| Multi-platform compatibility | Works with NinjaTrader, MetaTrader, TradeStation, and Interactive Brokers |
🎯 Key Point: Your strategy earned its place in live markets — deploy infrastructure worthy of that work.
🔑 Takeaway: A trading VPS isn't an optional upgrade — it's the foundation that determines whether your validated edge survives contact with real market conditions.