
Backtesting on NinjaTrader 8 helps you test trading strategies using historical data, allowing you to evaluate performance before live trading. Here's a quick overview of how to get started and make the most of NinjaTrader's tools:
- Setup: Install NinjaTrader 8 on a reliable system or VPS. Enable multi-provider mode for multiple data feeds, and import historical data in the correct format for your trading instruments.
- Strategy Setup: Use custom NinjaScript, the Strategy Builder, or built-in strategies like Moving Average Crossover. Configure commission templates, slippage, and start dates for accurate results.
- Running Backtests: Use the Strategy Analyzer to select instruments, timeframes, and strategies. Adjust settings like commission, slippage, and fill processing for realistic simulations.
- Analyzing Results: Focus on metrics like Profit Factor (goal: >1.5), Max Drawdown (<25%), and Sharpe Ratio (>1.0). Review charts, trades, and execution logs to refine your strategy.
- Optimizations: Test parameter ranges using Exhaustive or Genetic optimization methods. Look for stable performance across multiple settings to avoid overfitting.
Tools like QuantVPS enhance backtesting with fast, uninterrupted operations, especially for complex optimizations. Use these steps to refine your strategy and transition confidently to live trading.
Why Backtesting is Non-Negotiable in Modern Trading
Retail traders often underestimate the damage an untested strategy can cause. You spend weeks building logic, refining your entry rules, feel confident in the setup, and then watch real money disappear in the first month because the edge you believed in never existed. According to For Traders Blog, over 80% of traders who skip backtesting fail within their first year.
"Over 80% of traders who skip backtesting fail within their first year of trading." — For Traders Blog
⚠️ Warning: Confidence in a strategy without historical validation is one of the most costly mistakes a retail trader can make. Feeling ready is not the same as being statistically proven.
The failure point is usually not the strategy itself, but the lack of historical stress-testing across different market conditions, volatility regimes, and liquidity environments. A moving average crossover system that looks clean on a trending week in March can fall apart completely during a choppy, range-bound August. Without running that system through years of historical data, you are essentially assuming the answer before checking.
| Market Condition | Risk Without Backtesting |
|---|---|
| Trending Market | Strategy appears to work, creating false confidence |
| Choppy/Range-Bound | The system breaks down, causing unexpected losses |
| High Volatility Regime | Entry rules misfire, amplifying drawdowns |
| Low Liquidity Environment | Execution assumptions collapse in real conditions |
🔑 Takeaway: A strategy tested on one favorable market condition is not a strategy — it's a coincidence. Backtesting across multiple regimes is the only way to know if your edge is real and durable.
💡 Tip: When backtesting, always include at least one high-volatility period, one trending period, and one range-bound period to stress-test your system across genuinely different conditions.
What separates validated strategies from untested ones?
What separates serious traders from the rest is discipline around validation. The Strategy Analyzer in NinjaTrader 8 provides a structured environment for running backtests over custom date ranges, applying realistic commission and slippage settings, and measuring performance metrics such as profit factor, maximum drawdown, and Sharpe ratio. Each metric reveals how your system behaves under pressure.
Most traders run a backtest once, see a positive equity curve, and stop. A single backtest pass only reveals how a strategy performed on one fixed slice of historical data. Real validation comes from walk-forward analysis, where you test on rolling out-of-sample periods, and from parameter sensitivity testing, where you confirm your strategy works across multiple settings. For Traders Blog reports that backtesting can improve strategy performance by up to 30% before live deployment.
How does your testing environment affect backtest reliability?
Running backtests manually on a local machine creates data gaps and breaks simulation sequences, corrupting results. Our trading VPS keeps your NinjaTrader environment running continuously, enabling multi-day optimization jobs and automated strategy testing to complete without interruption or data loss.
How do you avoid over-optimization when backtesting in NinjaTrader 8?
Backtesting in NinjaTrader 8 exposes the risk of over-optimization. Curve-fitting a strategy to past data is one of the most common reasons systems fail when they go live. The fix is to test smarter, using out-of-sample validation and Monte Carlo analysis to confirm that your results hold across randomized conditions, not just the exact historical sequence you trained on.
Can I Backtest on Ninjatrader for Free?
Yes, but with important limits. NinjaTrader offers free backtesting only under certain conditions — and knowing exactly what those conditions are is critical before you commit time to building a strategy.
"Free backtesting is available on NinjaTrader, but traders must understand the platform restrictions that apply before assuming full functionality is unlocked." — NinjaTrader Platform Overview
| Access Type | Backtesting Available? | Key Limitation |
|---|---|---|
| Free/Sim Mode | ✅ Yes | Limited data and features |
| Paid License | ✅ Yes | Full access, no restrictions |
| Brokerage Account | ✅ Yes | Requires a funded account |
Run 24/7 while you sleep. Keep bots, platforms, and trade copiers online on a dedicated VPS.
Low-latency VPS hosting for your trading platform.
From $59.99/mo
💡 Tip: If you're just getting started, the free backtesting mode is a solid way to test your strategy — but always verify which data feeds and historical ranges are accessible at no cost.
⚠️ Warning: Not all features are unlocked in the free tier — advanced strategy testing may require a paid NinjaTrader license or a live brokerage connection to access full historical data.
 🎯 Key Point: Free backtesting on NinjaTrader is real, but it comes with platform-specific conditions that can limit your results if you're not aware of them upfront.
What you can do for free
If you use NinjaTrader in its free or demo mode, you can run strategy backtests using historical data through Strategy Analyzer, use Market Replay data for simulated historical trading, and build and test automated strategies with NinjaScript.
If you use NinjaTrader in its free/demo mode, you can:
- Run strategy backtests using historical data (via Strategy Analyzer)
- Use Market Replay data (simulated historical trading)
- Practice and test strategies in a simulated environment
- Build and test automated strategies with NinjaScript
So from a pure “can I test a strategy on past data?” perspective → yes, free is enough to start.
What you don’t get for free
Free access comes with restrictions:
- You’ll typically rely on delayed or limited historical data feeds
- Advanced features and full automation workflows may require a funded account or paid data subscription
- Live trading features and higher-quality institutional data are usually behind brokerage/data costs
- Some brokers integrated with NinjaTrader may require a funded account for full functionality
The key nuance (this is what most people miss)
“NinjaTrader is free” really means: The platform is free — data and full professional-grade usage are not necessarily free. Backtesting is only as good as the historical data you feed it, and that’s where costs usually appear.
Getting Ready to Backtest on NinjaTrader 8
Installing NinjaTrader 8 and Configuring Your VPS
To get started, connect to your VPS using Remote Desktop Protocol (RDP). Use the IP address, username, and password provided in your VPS dashboard. Once you're logged in, download the latest NinjaTrader installer from ninjatrader.com/GetStarted.
Right-click the installer and select "Run as Administrator" to ensure proper installation with the necessary permissions. When the setup wizard appears, select the "Complete" installation option. After the installation is complete, reboot your VPS to ensure a clean environment.
Within NinjaTrader, go to Tools > Settings and enable "Multi-provider" mode. This allows you to connect to multiple data feeds simultaneously, which is crucial for more accurate backtesting. Don’t forget to restart NinjaTrader Desktop to apply these changes. If you're using QuantVPS servers based in Chicago, you’ll benefit from lightning-fast execution speeds of 0–1 ms, ensuring a stable platform for intensive backtesting tasks.
With everything set up, you’re ready to import the historical data needed for your backtests.
Importing Historical Data for Your Trading Instruments
To import data, navigate to Tools > Import > Historical Data. Your data files must be in CSV format, with columns like DateTime, Price, and Volume, formatted using the yyyyMMdd HHmmss timestamp. File names should match NinjaTrader's naming conventions, such as "EURUSD.Bid" or "EURUSD.Ask".
During the import, select the relevant trading instrument, choose the data type (Ask, Bid, or Last), and ensure the time zone matches your data source. Enable the "Generate Day bars from imported tick or minute data" option if you need to create higher-timeframe candles from granular data. If the imported data doesn’t show up immediately, simply close and reopen the Historical Data window to refresh it.
Setting Up Your Trading Strategy
You can select a strategy using custom NinjaScript, the visual Strategy Builder, or one of NinjaTrader’s built-in examples, such as the Moving Average Crossover. Before running your first backtest, configure Commission Templates and tick-based Slippage in the Strategy Analyzer for more realistic results.
Set the "Set order quantity" parameter to "Default quantity" to keep control over position sizing during tests. If your strategy relies on long-period indicators, such as a 200-period moving average, make sure to set the backtest start date far enough in advance. This gives your indicators time to "warm up" and generate accurate signals.
How to Run a Backtest in Strategy Analyzer
Setting Up Strategy Analyzer for Basic Backtests
To get started, open the Strategy Analyzer by navigating to New > Strategy Analyzer. In the General section, set the Backtest Type to "Backtest" for a standard historical analysis. From the Strategy dropdown menu, choose your desired strategy. This could be a custom NinjaScript strategy, one created using the Strategy Builder, or a pre-built example like the Moving Average Crossover. Under Data Series, select the instrument you want to test (e.g., MNQ, EURUSD, or AMZN) and configure the timeframe, such as 1, 5, or 15-minute bars. Specify the historical period for your analysis by entering the Start date and End date.
Adjusting Backtest Settings and Parameters
For a more realistic simulation, tweak the settings in the Setup section. Enable Include commission and select a commission template to ensure your net profit accounts for trading costs. To simulate market conditions more accurately, add slippage by entering a value in ticks (commonly 1–2 ticks) to reflect the potential gap between order placement and execution.
In the Historical Fill Processing section, you can choose between two fill settings: Default, which is more conservative and fills limit orders only when the price penetrates the specified level, or Liberal, which fills orders as soon as the price touches the level. For initial testing, the Default setting is often recommended. In the Parameters section, adjust any inputs specific to your strategy, such as moving average periods or profit targets. Once all settings are finalized, click Run to begin the backtest.
Running the Backtest and Viewing Results
After the backtest completes, the results are displayed across several tabs:
- The Summary tab provides key performance metrics like net profit, drawdown, and win rate.
- The Chart tab visually maps your strategy's entries and exits on a price chart, helping you confirm that trades align with your strategy's logic.
- The Executions tab lists all individual entry and exit points for detailed analysis.
- The Trades tab organizes completed trades into round-turn groups, showing their respective profit and loss figures.
Need to revisit a previous test? Right-click inside the Strategy Analyzer and select Show Logs. This allows you to review a complete history of past backtests, including the specific parameters and code snapshots used at the time.
| Result Tab | Description |
|---|---|
| Summary | Displays overall performance metrics like net profit and drawdown. |
| Chart | Visualizes the price chart with buy and sell orders marked on the bars. |
| Executions | Lists each individual entry and exit point. |
| Trades | Groups executed trades into round-turn trades with profit and loss details. |
Understanding Your Backtest Results
NinjaTrader 8 Backtest Performance Metrics Standards and Benchmarks
Once your backtest wraps up, it’s time to focus on the metrics that reveal whether your strategy has the potential to succeed in live trading.
Stay online and closer to execution. Choose a VPS location for CME futures, New York markets, London FX, API trading, and more.
Host your platform near the market route that matters.
From $59.99/mo
Key Performance Metrics to Watch
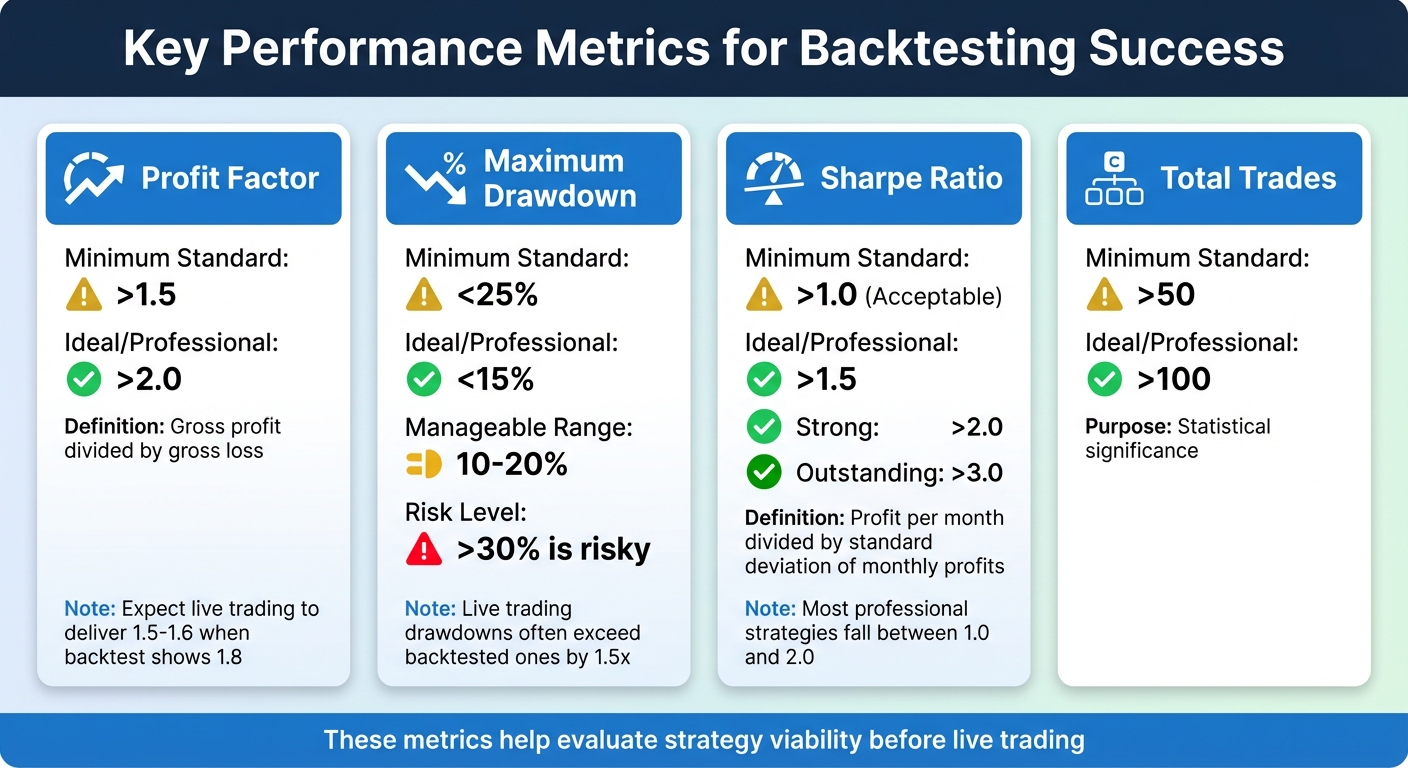
While Total Net Profit often grabs attention, Profit Factor gives a clearer picture. It divides gross profit by gross loss, showing how much you gain for every dollar risked. A value above 1.5 is the minimum for a tradable strategy, while 2.0–3.0 is a strong range. For example, if your backtest shows a profit factor of 1.8, expect live trading to deliver closer to 1.5–1.6 due to execution delays in real-world conditions.
Maximum Drawdown highlights the largest drop from a peak to a trough in your equity. Generally, a drawdown of 10–20% is manageable, but anything over 30% is risky. Keep in mind, live trading drawdowns often exceed backtested ones, sometimes by 1.5x. Make sure you’re emotionally prepared for this possibility.
The Sharpe Ratio measures how well your strategy balances risk and return. NinjaTrader 8 calculates it by dividing profit per month by the standard deviation of monthly profits. A Sharpe Ratio above 1.0 is acceptable, above 2.0 is strong, and above 3.0 is outstanding. Most professional strategies fall between 1.0 and 2.0.
Win Rate (or Percent Profitable) becomes meaningful when paired with your risk-reward ratio. Even a low win rate can work if your winning trades are significantly larger than your losing ones. Other helpful metrics include Average MAE (Maximum Adverse Excursion), which reflects poor entry conditions if too high, and Average ETD (End Trade Drawdown), which shows how much profit is lost before a trade closes.
| Metric | Minimum Standard | Ideal/Professional |
|---|---|---|
| Profit Factor | >1.5 | >2.0 |
| Max Drawdown | <25% | <15% |
| Sharpe Ratio | >1.0 | >1.5 |
| Total Trades | >50 | >100 |
After analyzing these metrics, test your strategy on multiple instruments to ensure its consistency.
Testing Across Multiple Instruments
A strategy that performs well on one instrument might fail on another. NinjaTrader 8’s Strategy Analyzer lets you conduct "Basket tests", comparing your strategy across various instruments and timeframes.
To set up a basket test, add multiple data series in the Strategy Analyzer and click Run. Results are displayed in separate tabs for each instrument, making it easy to spot where your strategy thrives or struggles. If you see consistent profit factors across instruments, your strategy is robust. On the other hand, if it only works on MNQ during a specific three-month period, it’s likely overfitted.
These tests help lay the groundwork for understanding how your strategy might fare in live trading.
Bridging the Gap Between Backtest and Live Trading
Once you’ve reviewed performance metrics and tested across instruments, it’s time to compare your findings with live trading conditions.
Backtests often appear more profitable because they skip transaction costs and rely on simplified fill assumptions. NinjaTrader offers two fill algorithms: "Default", which fills limit orders only when the price is penetrated, and "Liberal", which fills orders when the price is merely touched. For more realistic results, stick with the "Default" fill type.
Live trading captures every bid/ask tick, whereas backtests rely on historical high/low data. This difference can lead to execution gaps, especially in volatile markets. To account for this, manually increase slippage and commissions in the Strategy Analyzer to identify the point where your strategy becomes unprofitable.
Finally, low average profit per trade can be wiped out by transaction costs. For a strategy to be viable, its expectancy should exceed costs by at least 2–3x.
Improving Your Strategy After Backtesting
Once you've reviewed your backtest metrics and made initial adjustments in live trading, the next step is refining your strategy for consistent results. Backtesting often reveals areas for improvement, and targeted adjustments can address those weaknesses. Tools like NinjaTrader 8's Strategy Analyzer allow you to test parameter ranges and identify configurations that balance profitability with stability. The aim here isn't to chase the highest historical profits - it’s to develop settings that perform reliably in varying market conditions.
Running Optimizations in NinjaTrader 8
NinjaTrader 8 offers two optimization methods: Default (Exhaustive) and Genetic. The Exhaustive method tests every possible parameter combination, ensuring thorough historical results. However, it becomes slower as you add more variables. The Genetic method, on the other hand, approximates the best solution by testing a smaller subset of combinations, making it faster for strategies with many parameters.
"Trading strategy optimization can be like baking a cake: you start with a basic recipe, but adjust the ingredients to enhance the flavor." - NinjaTrader Team
To get started, define a range (Min, Max, Increment) for each key parameter. Instead of optimizing everything at once, focus on smaller, related groups of parameters with narrow value ranges. This approach minimizes the risk of overfitting to historical data noise. Key inputs like stop-loss distances or entry trigger thresholds often have the most noticeable impact on performance, so prioritize these during testing.
After running an optimization, examine the results graph closely. Look for plateaus - broad, stable areas where performance remains consistent across multiple parameter values. Plateaus indicate a strategy's stability, while sharp performance drops due to minor parameter changes suggest overfitting. As MooreTech LLC explains, "Plateaus suggest the system is less sensitive to small changes, which is good in live markets".
To validate your optimized settings, use walk-forward analysis. This involves optimizing your strategy on one historical segment, then testing it on the subsequent period without re-optimization. Repeat this process across multiple segments. If at least 50% of your forward-test results match or exceed the optimized performance, your strategy can be considered stable and reliable.
Running Multiple Optimizations with VPS Infrastructure
Refining your strategy through optimization can be resource-intensive, particularly when testing across multiple instruments or using walk-forward analysis over long timeframes. This is where robust VPS infrastructure can make a difference. With the ability to handle demanding workloads, QuantVPS Ultra offers 24 cores and 64GB of RAM, enabling you to process multiple optimization tasks simultaneously. Dedicated resources ensure smooth operations without bottlenecks.
One critical metric to watch during optimizations is steal time (%st) - this measures interruptions caused by other users on a shared server. Even a small amount of steal time (above 0.0%) can slow down computations, while values exceeding 5% can significantly impact performance. High-quality VPS solutions reduce steal time by providing dedicated physical cores, allowing your optimizations to run without delays.
Additionally, enterprise-grade NVMe storage and high IOPS (Input/Output Operations Per Second) enhance database query speeds during the Strategy Analyzer’s processing of large historical datasets. This means you can complete optimization iterations faster, testing more parameter combinations in less time. For traders working on multi-chart optimizations or portfolio-level strategies, this infrastructure advantage translates into quicker refinements and more thorough validation of your trading systems.
Conclusion
Backtesting on NinjaTrader 8 demands a solid setup, reliable data, and careful analysis. Begin by installing the platform on dependable hardware, importing accurate historical data, and clearly defining your trading rules before running any tests. To ensure realistic results, always account for commissions and slippage in your settings.
When analyzing your backtest results, focus on key performance metrics like expectancy and profit factor. These provide deeper insights into your strategy's potential than just looking at win rates. This iterative approach helps you refine your strategies and pinpoint areas for improvement before committing real money.
For traders running complex optimizations - such as testing multiple instruments or conducting walk-forward analysis - VPS hosting becomes a necessity. Services like QuantVPS offer 99.999% uptime and dedicated resources, ensuring smooth performance without bottlenecks. With enterprise-grade NVMe storage, you can process large datasets more efficiently, allowing for faster and more thorough optimization cycles.
To protect your work, regularly back up your NinjaTrader configurations, databases, and NinjaScript strategies to cloud services like Google Drive or OneDrive. Pairing this habit with reliable hosting ensures your backtesting environment remains secure and accessible around the clock, whether you're refining a strategy or preparing for live trading.
A well-executed backtesting process lays the foundation for live trading success. Transitioning from testing to live execution depends heavily on stable infrastructure. Low-latency connections and consistent uptime help reduce slippage and improve the reliability of your strategy in live markets. By combining NinjaTrader 8's advanced tools with dependable VPS hosting, you create a professional workflow that supports confident, data-driven trading decisions.
FAQs
How much historical data do I need for a reliable backtest?
To conduct a reliable backtest, it's crucial to have a substantial amount of historical data that spans different market conditions and trends. Ideally, this means working with several years of tick or intraday data - about 15 years is often recommended for a comprehensive analysis. Using such an extensive data range allows for better evaluation and fine-tuning of your strategies.
Which fill setting should I use for more realistic results?
For more realistic backtesting in NinjaTrader 8, enable the High Order Fill Resolution setting. This feature improves the accuracy of order fills during backtests, offering a closer approximation to real trading scenarios. However, it’s worth noting that this may slightly increase processing time, so it's best reserved for situations where precision is critical.
How can I spot overfitting after optimization?
Overfitting happens when a strategy excels with historical data but struggles in live trading or walk-forward testing. This usually means the strategy is overly customized to past patterns and doesn’t work well under changing market conditions. To spot overfitting, keep an eye on live performance and compare it to backtest results. The key is ensuring the strategy performs consistently across various data sets.


