
The wedge pattern is a popular chart formation in trading that signals a potential breakout as price action tightens between two converging trendlines. This pattern can indicate either a reversal or continuation, depending on whether it’s a rising wedge (bearish) or falling wedge (bullish). Here’s what you need to know:
- Rising Wedge: Both trendlines slope upward; typically signals a bearish breakout.
- Falling Wedge: Both trendlines slope downward; usually signals a bullish breakout.
- Key Features: Requires at least three touches on each trendline, declining volume during formation, and a volume spike at breakout.
- Entry Strategies: Enter immediately after a breakout or wait for a retest of the broken trendline.
- Stop-Loss Placement: Place just beyond the last swing high (rising wedge) or low (falling wedge).
- Profit Targets: Measure the wedge’s height and project it from the breakout point.
Wedge patterns work well in liquid markets like forex and futures, where institutional activity drives sharp breakouts. Use tools like RSI, MACD, and volume analysis to confirm trades and avoid false signals. Patience and proper validation are key to trading these patterns effectively.
How to Identify and Validate Wedge Patterns
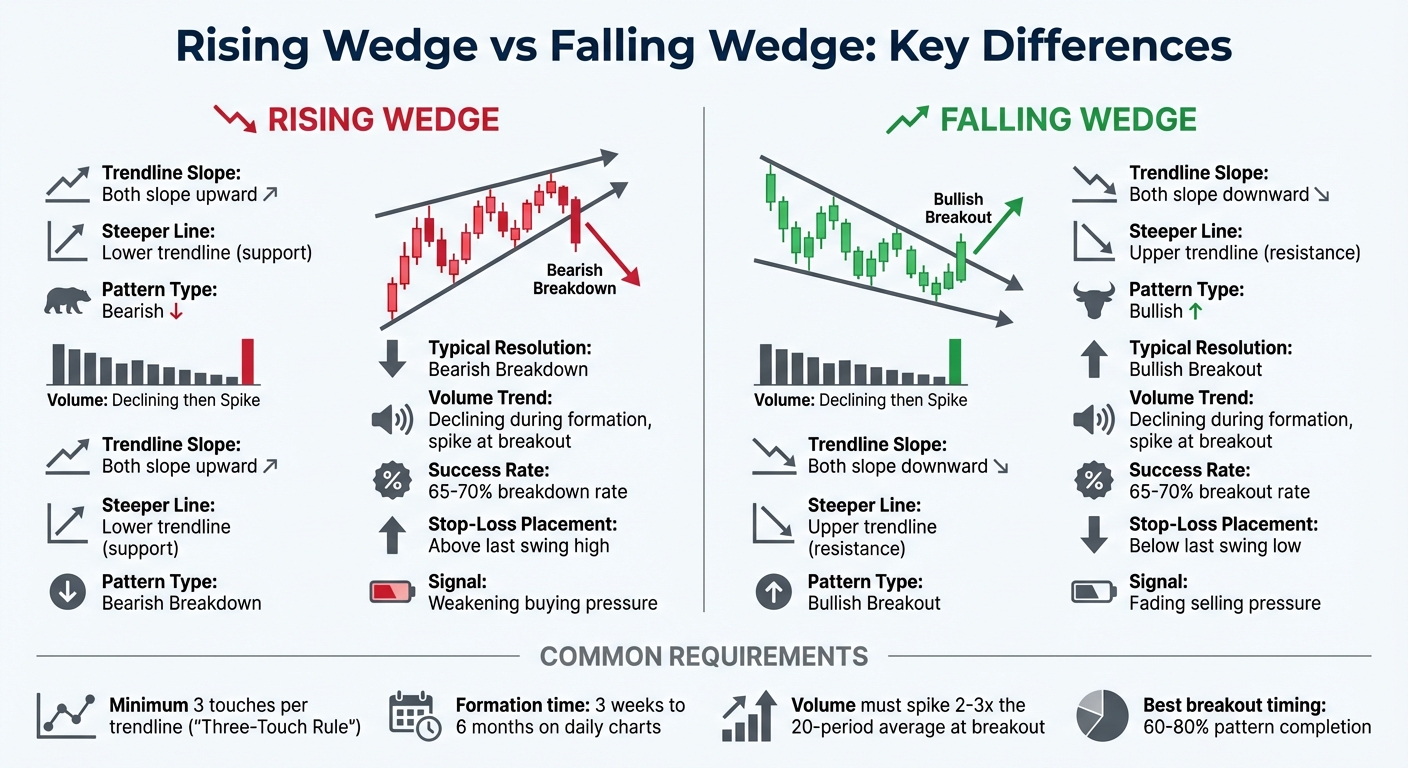
Rising vs Falling Wedge Pattern Comparison Chart
Pinpointing a wedge pattern on a chart is just the first step. To make it actionable, you need to validate the pattern to filter out false signals and unreliable setups.
Key Characteristics of Wedge Patterns
For a wedge pattern to hold up under scrutiny, its trendlines must converge, but at different angles. This creates a "squeezing" effect as the highs and lows move closer together. In a rising wedge, the lower support line rises more sharply than the upper resistance line. In contrast, a falling wedge has the upper resistance line dropping more steeply than the lower support line.
A vital rule for validation is the "three-touch rule", meaning both trendlines must be tested at least three times. Forex trader and educator Justin Bennett emphasizes this point:
"The wedge must have three touches on each side in order to be considered tradable".
Some systems go further, requiring five touches - three on one side and two on the other - to confirm the pattern. Additionally, volume should decline steadily as the pattern forms and then surge when the breakout occurs. On daily charts, wedges typically take between three weeks and six months to fully develop.
Once you’ve identified a wedge, the next step is to determine whether it’s a rising or falling wedge, as this dictates your trading bias.
How to Tell Rising and Falling Wedges Apart
Rising and falling wedges might look similar at first glance, but their implications are very different:
- Rising Wedge: Both trendlines slope upward, forming higher highs and higher lows. Despite the upward movement, this is a bearish pattern, signaling weakening buying pressure.
- Falling Wedge: Both trendlines slope downward, creating lower highs and lower lows. Though it points downward, this is a bullish pattern, indicating that selling pressure is fading.
A real-world example of a rising wedge occurred with the Vanguard Financials ETF (VFH) between October 10, 2022, and March 20, 2023. The support line was defined by higher lows at $72.96 and $80.37, while resistance came from higher highs at $88.83 and $90.87. Volume steadily declined during the formation, and the price eventually broke down, hitting $74.09 by March 27, 2023.
Run 24/7 while you sleep. Keep bots, platforms, and trade copiers online on a dedicated VPS.
Low-latency VPS hosting for your trading platform.
From $59.99/mo
| Feature | Rising Wedge | Falling Wedge |
|---|---|---|
| Trendline Slope | Both slope upward | Both slope downward |
| Steeper Line | Lower trendline | Upper trendline |
| Typical Resolution | Bearish Breakdown | Bullish Breakout |
| Volume Trend | Declining during formation | Declining during formation |
Grasping these differences is essential to avoid misidentifying patterns and trading against the trend.
Common Mistakes When Identifying Wedge Patterns
One frequent error is entering a trade too early, after just two touches on each trendline. Always wait for the third touch to confirm the pattern. It's also crucial to analyze the pattern across multiple timeframes. For example, a wedge that looks clean on a 15-minute chart might show false breaks when viewed on a 4-hour or daily chart.
Another mistake is waiting too long. If you hold off until the price reaches the tip (or apex) of the wedge, you might miss the decisive breakout and end up with weak, aimless price action instead. A breakout without a volume spike is another red flag, as it often signals a lack of institutional support and increases the likelihood of failure.
Rising wedges tend to break down successfully about 65% to 70% of the time, but keep in mind that 30% to 35% of these patterns might break upward instead, defying expectations.
Once you’ve validated a wedge pattern, the next step is to focus on precise entry and exit strategies to maximize your trading opportunities.
Entry and Exit Strategies for Wedge Breakouts
Once you've identified a wedge pattern, the next step is all about execution. Success hinges on timing your entry, using stop-loss orders to protect your capital, and setting achievable profit targets. These steps distinguish traders with a plan from those who react impulsively to market moves.
Entry Rules for Wedge Breakouts
When entering a wedge breakout trade, you generally have two choices: immediate entry or retest entry.
- Immediate Entry: This involves entering the trade as soon as a candle closes decisively outside the wedge boundary. While this approach captures the entire move, it comes with the risk of falling for a false breakout.
- Retest Entry: This more cautious method involves waiting for the price to return and test the broken trendline. In bullish breakouts, the trendline acts as new support; in bearish breakouts, it becomes resistance. This strategy often offers a better risk-to-reward ratio and confirms the breakout's validity.
Take the EUR/USD currency pair as an example. Over ten months, it formed a large rising wedge on the daily chart. The 4-hour chart showed multiple intraday breaks above resistance, but these turned out to be wicks. The daily timeframe provided a clearer picture, leading to an eventual 3,000-pip breakdown. This underscores the importance of focusing on the timeframe that best respects the trendlines.
| Entry Type | Pros | Cons |
|---|---|---|
| Immediate Breakout | Captures the full move; avoids missing trends | Higher risk of fakeouts; stop-loss may be farther away |
| Retest Entry | Confirms breakout; tighter stop-loss possible | Risk of missing the move if price doesn't retest |
Once you've chosen your entry strategy, the next step is to protect your trade with a well-placed stop-loss.
Where to Place Stop-Loss Orders
The rule for stop-loss placement is straightforward: position it where the wedge pattern becomes invalid.
- For a rising wedge (bearish breakout), place the stop-loss above the last swing high inside the pattern. If the price hits this level, it signals a new high, invalidating the bearish outlook.
- For a falling wedge (bullish breakout), position the stop-loss below the last swing low.
Justin Bennett, founder of Daily Price Action, explains:
"Always place your stop-loss in an area where the setup can be considered invalidated if hit".
If you're entering on a retest and spot a reversal candlestick like a pin bar, you can tighten your stop by placing it just beyond the candlestick's tail. Aim for a risk-to-reward ratio of at least 1:2, meaning your profit target should be at least twice the distance of your stop-loss. Keep your risk per trade to only 1–2% of your account equity.
After securing your position with a stop-loss, the next step is calculating realistic profit targets.
How to Calculate Profit Targets
One common way to set profit targets is by measuring the height of the wedge at its widest point (the base) and projecting that distance from the breakout point.
- For falling wedges, previous swing highs that formed the pattern make natural take-profit levels.
- For rising wedges, previous swing lows serve as logical targets.
As your trade moves closer to the target, consider using a trailing stop to lock in profits and shield yourself from sudden market reversals.
Using Technical Indicators to Confirm Breakouts
Stay online and closer to execution. Choose a VPS location for CME futures, New York markets, London FX, API trading, and more.
Host your platform near the market route that matters.
From $59.99/mo
Wedge patterns can often lead to breakouts that reverse unexpectedly, catching traders off guard. This is where technical indicators become essential - they help separate real breakouts from misleading ones.
Volume analysis is one of the most effective tools for confirmation. During the formation of a wedge, volume tends to decrease. At the point of breakout, however, volume needs to spike significantly - reaching two to three times the 20-period average. Without this increase, the breakout lacks the necessary conviction to be reliable. As John J. Murphy explains:
"Volume is your confirmation tool. Without declining volume during formation and expanding volume at breakout, you're trading hope, not evidence."
Other indicators, like RSI, MACD, and Stochastic, can provide additional confirmation. For example:
- In a rising wedge, bearish divergence - where prices make higher highs, but RSI forms lower highs - signals that momentum is fading.
- In a falling wedge, bullish divergence suggests that a breakout is likely approaching.
The MACD is particularly useful for confirming breakouts. A bearish crossover (signal line crossing above the MACD line) supports a breakdown in a rising wedge, while a bullish crossover (signal line crossing below the MACD line) aligns with a breakout in a falling wedge. Additionally, an expanding histogram indicates growing momentum in the direction of the breakout.
To refine your strategy, prioritize volume as the main confirmation tool. If volume doesn’t increase at the breakout, it’s a strong signal to avoid the trade, even if other indicators suggest otherwise. Use oscillator divergence and MACD crossovers as secondary checks to validate your decision. Together, these tools can help fine-tune your entry points and improve the reliability of your trades.
Advanced Techniques for Trading Wedge Patterns
Using Multi-Timeframe Analysis
A multi-timeframe approach can add depth to your wedge pattern strategy. Start by analyzing the market direction on higher timeframes like Daily or Weekly charts. Then, pinpoint the wedge formation on intermediate timeframes, such as the 4-hour chart. Finally, refine your entry points using lower timeframes, like the 15-minute chart, by looking for confirmation signals - think of patterns like a pin-bar retest.
For example, let’s say GBP/USD shows a clear downtrend on the Daily chart but forms a rising wedge on the 4-hour chart. This wedge might signal a weak relief rally. If the price breaks below the wedge, it could offer a strong entry point to align with the broader downtrend. By combining multiple timeframes, you can filter out market noise and improve your trade accuracy.
From here, it’s important to incorporate the broader market context to fully understand the wedge's potential.
Aligning Wedges with Market Context
The significance of a wedge often depends on the trend that came before it. For instance, in an uptrend, a rising wedge usually indicates a bearish reversal. On the other hand, if the market is in a downtrend, the same rising wedge often acts as a continuation pattern - a brief pause before the downtrend resumes. Timing matters too: breakouts tend to be more powerful when the wedge is 60% to 80% complete. Waiting until the pattern nears the apex might result in a less impactful move.
Beyond technical analysis, external factors play a big role. Events like shifts in US Treasury yields, macroeconomic reports, or major news can influence whether a wedge breakout holds or fizzles. To manage risk, place your stop-loss orders just beyond the most recent swing high or low within the wedge. This way, if the price hits your stop-loss, the trade setup is clearly invalidated.
Conclusion
Wedge patterns, as we've explored, offer a structured way to approach breakout trading with discipline and precision. These patterns highlight moments when a trend is weakening, signaling either a reversal or continuation in momentum. Essentially, they reflect market exhaustion, where buyers or sellers struggle to maintain control despite pushing prices to new highs or lows.
The key to success lies in proper validation. A reliable wedge pattern should have at least three touches on each trendline, show declining volume during its formation, and experience a noticeable volume spike during the breakout . Adding momentum indicators like RSI or MACD - especially when they reveal divergence - can significantly improve your odds, helping you eliminate roughly 40% of patterns that are likely to fail. As Marcus Chen, Senior Forex Analyst at FXNX, aptly states:
"Mastering the Rising and Falling Wedge patterns requires moving beyond simple shape recognition and into the realm of market sentiment analysis".
When trading wedge patterns, patience is crucial. Wait for a decisive candle close and a valid retest of the broken trendline before entering. This strategy not only improves your risk-to-reward ratio but also minimizes the chances of falling victim to fakeouts. Place your stop-loss just beyond the most recent swing within the wedge, ensuring the setup remains valid. This careful approach to risk management is essential for achieving consistent results.
For profit targets, project the height of the wedge from the breakout point, aiming for at least a 2:1 reward-to-risk ratio. Limit your risk to 1%–2% of your account equity per trade. Keep in mind that the most dynamic moves tend to occur when the wedge is 60%–80% complete. Waiting until the apex often results in weaker momentum.
FAQs
How do I avoid false wedge breakouts?
To steer clear of false wedge breakouts, it's essential to look for extra confirmation signals. One reliable method is to wait for a second close beyond the trendline or key level, especially if it’s accompanied by a noticeable increase in volume. Genuine breakouts are often marked by volume spikes, whereas false ones tend to show little to no volume change.
Another smart approach is to set stop-loss orders close to invalidation points. This helps limit potential losses if the breakout turns out to be false. Additionally, waiting for a retest of the broken trendline can provide extra confirmation and a more favorable entry point, making your risk management more effective.
What timeframe works best for wedge patterns?
Wedge patterns can show up on any timeframe, but the longer they take to form, the more powerful the breakout tends to be. That's why traders often favor daily or multi-day charts for analyzing wedge patterns. These timeframes offer clearer setups and make it easier to pinpoint dependable breakout opportunities.
What’s the best way to manage risk on wedge trades?
When trading wedge patterns, managing risk effectively is key. One smart approach is to place stop-loss orders just outside the pattern's invalidation points. This helps limit potential losses if the trade doesn't go as planned. At the same time, setting clear take-profit targets ensures disciplined exits, keeping emotions in check.
For better results, aim for a risk-to-reward ratio of at least 1:2. This means you're risking $1 to potentially gain $2 or more - helping to boost overall profitability. To add an extra layer of confidence, combine these methods with volume analysis and ensure the pattern is confirmed before entering the trade. These steps can make wedge trades safer and more calculated.


