
Order flow trading focuses on real-time market activity rather than historical charts, helping traders make faster, data-driven decisions. Tools like footprint charts, Depth of Market (DOM), and heat maps reveal live buying and selling pressure, making them essential for futures and options traders. This article compares six leading platforms - Bookmap, Sierra Chart, Jigsaw Trading, Optimus Flow, NinjaTrader Order Flow Plus, and Quantower - based on features, pricing, and trading styles.
Key Highlights:
- Bookmap: Known for heatmap visuals; prices range from free to $99/month or lifetime licenses ($990-$1,990).
- Sierra Chart: Offers Market Depth Historical Graph and Numbers Bars; supports multiple data feeds; ideal for advanced customization.
- Jigsaw Trading: Simplified tools for scalping and day trading; starts at $197/month.
- Optimus Flow: Quantower-powered platform with all premium features included at $0 platform fee; requires funded Optimus Futures account; commission $0.25 per side.
- NinjaTrader Order Flow Plus: Includes advanced trade management tools; $59/month or free for lifetime license holders.
- Quantower: Multi-asset platform with modular design; freemium model with advanced features starting at $39/month.
Quick Comparison:
| Platform | Strengths | Weaknesses | Best For | Pricing |
|---|---|---|---|---|
| Bookmap | Heatmap visualization | Steep learning curve | Visual learners | $0-$99/month |
| Sierra Chart | Customizable, stable performance | Outdated interface | Advanced traders | Varies by data feed |
| Jigsaw Trading | User-friendly for scalping | Limited to futures | Scalpers, day traders | $197/month |
| Optimus Flow | All Quantower premium features included, zero platform fees | Windows-only desktop app | Order flow traders avoiding subscriptions | $0 (included with account) |
| NinjaTrader OF Plus | Advanced trade management | Extra costs for add-ons | NinjaTrader users | $59/month |
| Quantower | Multi-asset support | Overwhelming for beginners | Multi-market traders | $39-$79/month |
Choosing the right software depends on your trading style, experience, and budget. Scalpers might prefer Jigsaw Trading or NinjaTrader, while multi-asset traders could lean toward Quantower. Beginners can explore freemium options like Quantower or Bookmap's free plan.
Best Orderflow Tools & Platforms In 2023 (Bookmap & Sierra Charts)
1. Bookmap
Bookmap is a trading platform designed to visualize order flow, offering subscription plans that cater to different trading needs. Its pricing is straightforward, with four tiers available:
| Plan | Monthly Price | Annual Price | Key Features |
|---|---|---|---|
| Digital (Free) | $0 | $0 | Live crypto data, delayed stocks/futures, 1 symbol |
| Digital Plus | $19 | $16/month ($192/year) | Live crypto data, delayed stocks/futures, 3 symbols |
| Global | $49 | $39/month ($468/year) | Access to all markets, 10 symbols, all add-ons |
| Global Plus | $99 | $79/month ($948/year) | Premium features and enhanced performance |
For traders looking for a long-term option, Bookmap also offers lifetime licenses: $990 for the Global plan and $1,990 for Global Plus. These options allow users to align their subscription with their trading goals, providing flexibility that sets it apart from other platforms discussed later.
2. Sierra Chart
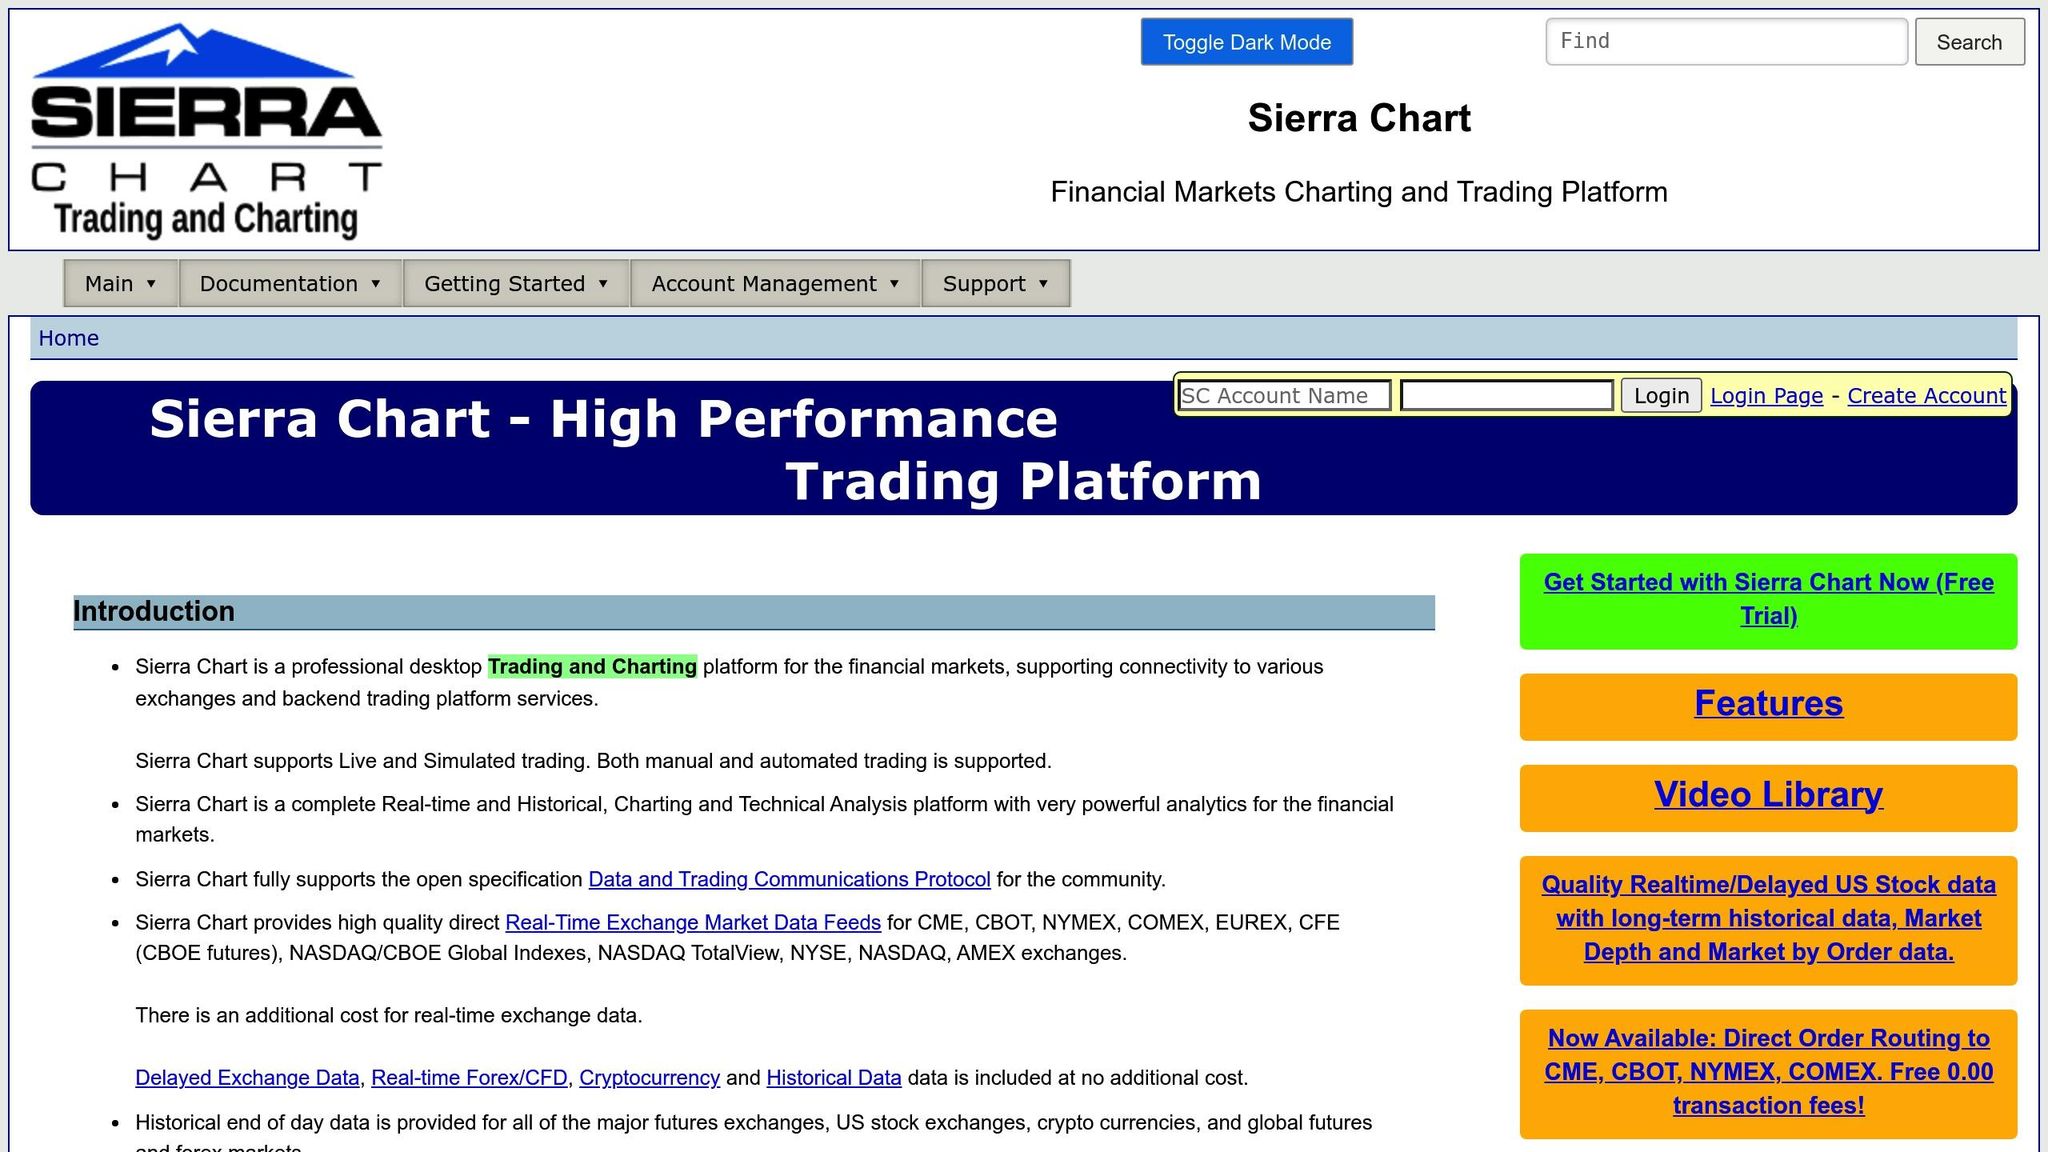
Sierra Chart stands out with its powerful tools for visualizing and executing order flow, providing traders with the insights they need to interpret real-time market activity effectively.
One of its standout features is the Market Depth Historical Graph and Numbers Bars, which display live bid and ask quantities. These tools make it easier to spot large order buildups and withdrawals, offering a clear view of market dynamics. These features are key when comparing Sierra Chart to other trading platforms.
In addition to visual tools, Sierra Chart's Depth of Market (DOM) window offers direct market access with features like customizable order entry buttons, bracket and OCO orders, scalable position sizing, and one-click trading using configurable hotkeys. These capabilities make it a strong choice for traders who prioritize speed and precision.
Sierra Chart integrates seamlessly with various data feeds, including CQG, Interactive Brokers, TD Ameritrade, and Rithmic, ensuring flexibility for futures and options trading. Its efficient performance is particularly suited for high-frequency scalping strategies, thanks to low-latency execution and tick-by-tick data processing. Running natively on Windows, it excels at managing system resources to maintain smooth operation even in fast-moving markets.
| Feature | Description | Best For |
|---|---|---|
| Market Depth Graph | Visualizes bid/ask levels over time | Spotting support/resistance zones |
| Numbers Bars | Shows real-time volume at each price level | Scalping and day trading |
| Advanced DOM | Customizable order entry with hotkeys | Fast execution strategies |
| Multiple Data Feeds | Connects with various brokers and data providers | Flexible trading setups |
While Sierra Chart may initially seem complex, this complexity opens the door to extensive customization. Traders can design their own studies, tweak existing indicators, and even develop automated trading systems using the platform's built-in programming language. This flexibility makes it a favorite for those who want a tailored trading experience.
Run 24/7 while you sleep. Keep bots, platforms, and trade copiers online on a dedicated VPS.
Low-latency VPS hosting for your trading platform.
From $59.99/mo
3. Jigsaw Trading
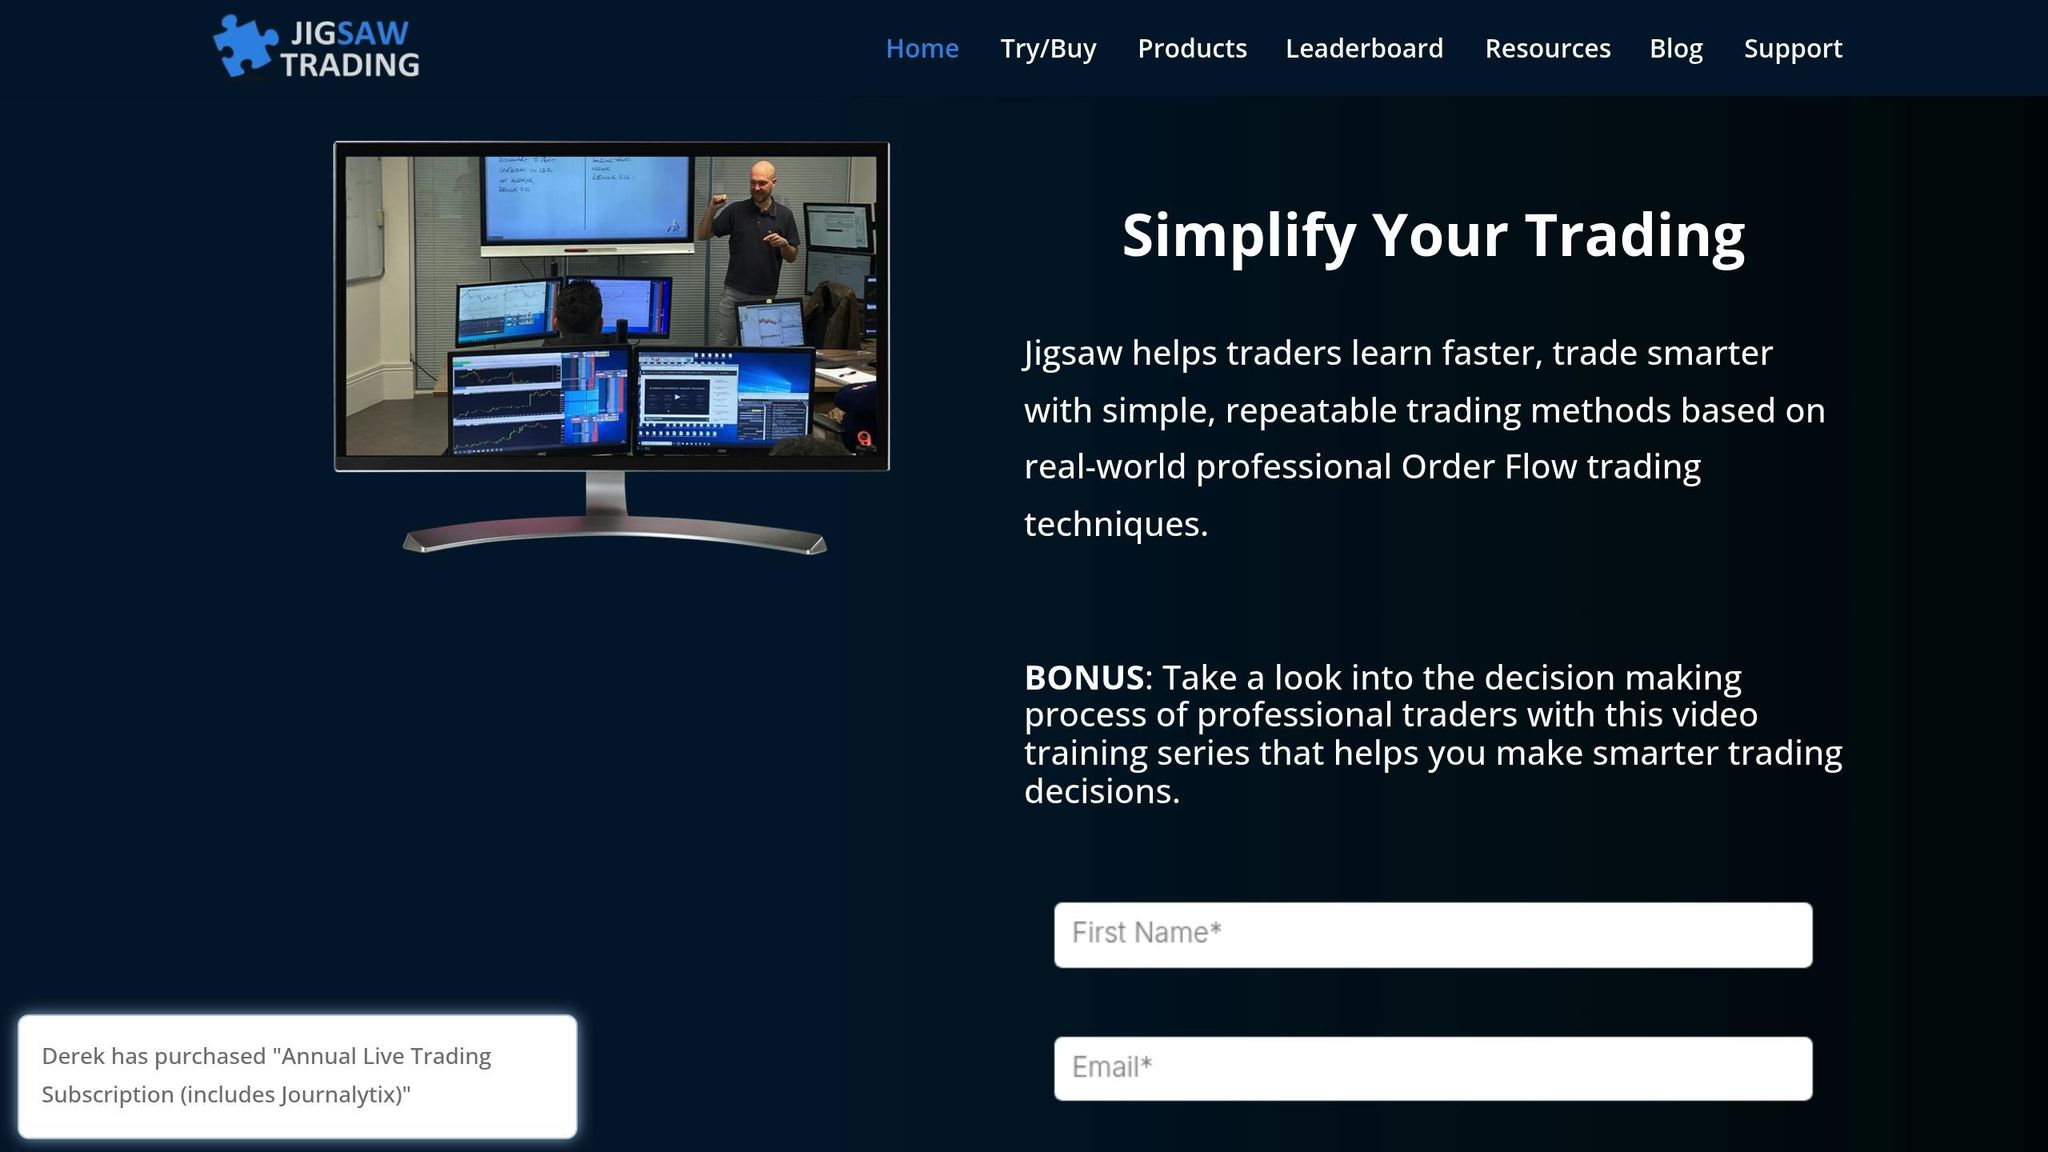
Jigsaw Trading specializes in order flow analysis, offering tools tailored for scalping and day trading in the futures markets. Its standout feature is a clean, user-friendly interface that simplifies complex data, making it easier for traders to focus on actionable insights without unnecessary distractions.
At the heart of the platform is the Jigsaw Depth & Sales tool, which combines a traditional DOM (Depth of Market) with real-time tape reading. This feature displays bid and ask sizes alongside actual trades, giving traders a clear view of the relationship between pending orders and executed transactions. The color-coded layout highlights large orders and unusual activity at specific price points, making it easier to spot key trading opportunities.
The Reconstructed Tape adds another layer of clarity by organizing standard time and sales data. It classifies trades as either hitting the bid or lifting the offer, providing a clearer picture of market sentiment. This is especially useful during volatile sessions, helping traders identify momentum shifts and act accordingly.
Jigsaw's DOM Trader window offers direct market access with customizable features for order entry and risk management. Designed for simplicity, it allows quick configuration, supports one-click trading, and includes automatic bracket orders to manage risk effectively. This makes it an excellent choice for traders who need fast execution without spending hours on setup.
For market connectivity, Jigsaw Trading integrates seamlessly with major futures brokers like CQG, Rithmic, and Interactive Brokers. With low-latency connections and tick-by-tick data processing, it’s well-suited for active markets like the E-mini S&P 500 and crude oil futures, where speed and precision are critical.
| Tool | Primary Function | Trading Style |
|---|---|---|
| Depth & Sales | Combined DOM and tape reading | Scalping and momentum trading |
| Reconstructed Tape | Organized bid/offer analysis | Sentiment-based strategies |
| DOM Trader | Direct market access with risk tools | Fast execution trading |
Jigsaw Trading operates on a subscription model, with pricing starting at $197 per month for the professional package. This includes all core order flow tools and real-time data connections. New users can take advantage of a 14-day free trial, which provides live market data to test the platform before subscribing.
The software is optimized for Windows and uses minimal system resources, ensuring smooth performance even during high-volume trading sessions. This efficiency is crucial for maintaining execution speed and profitability when markets are moving quickly.
4. Optimus Flow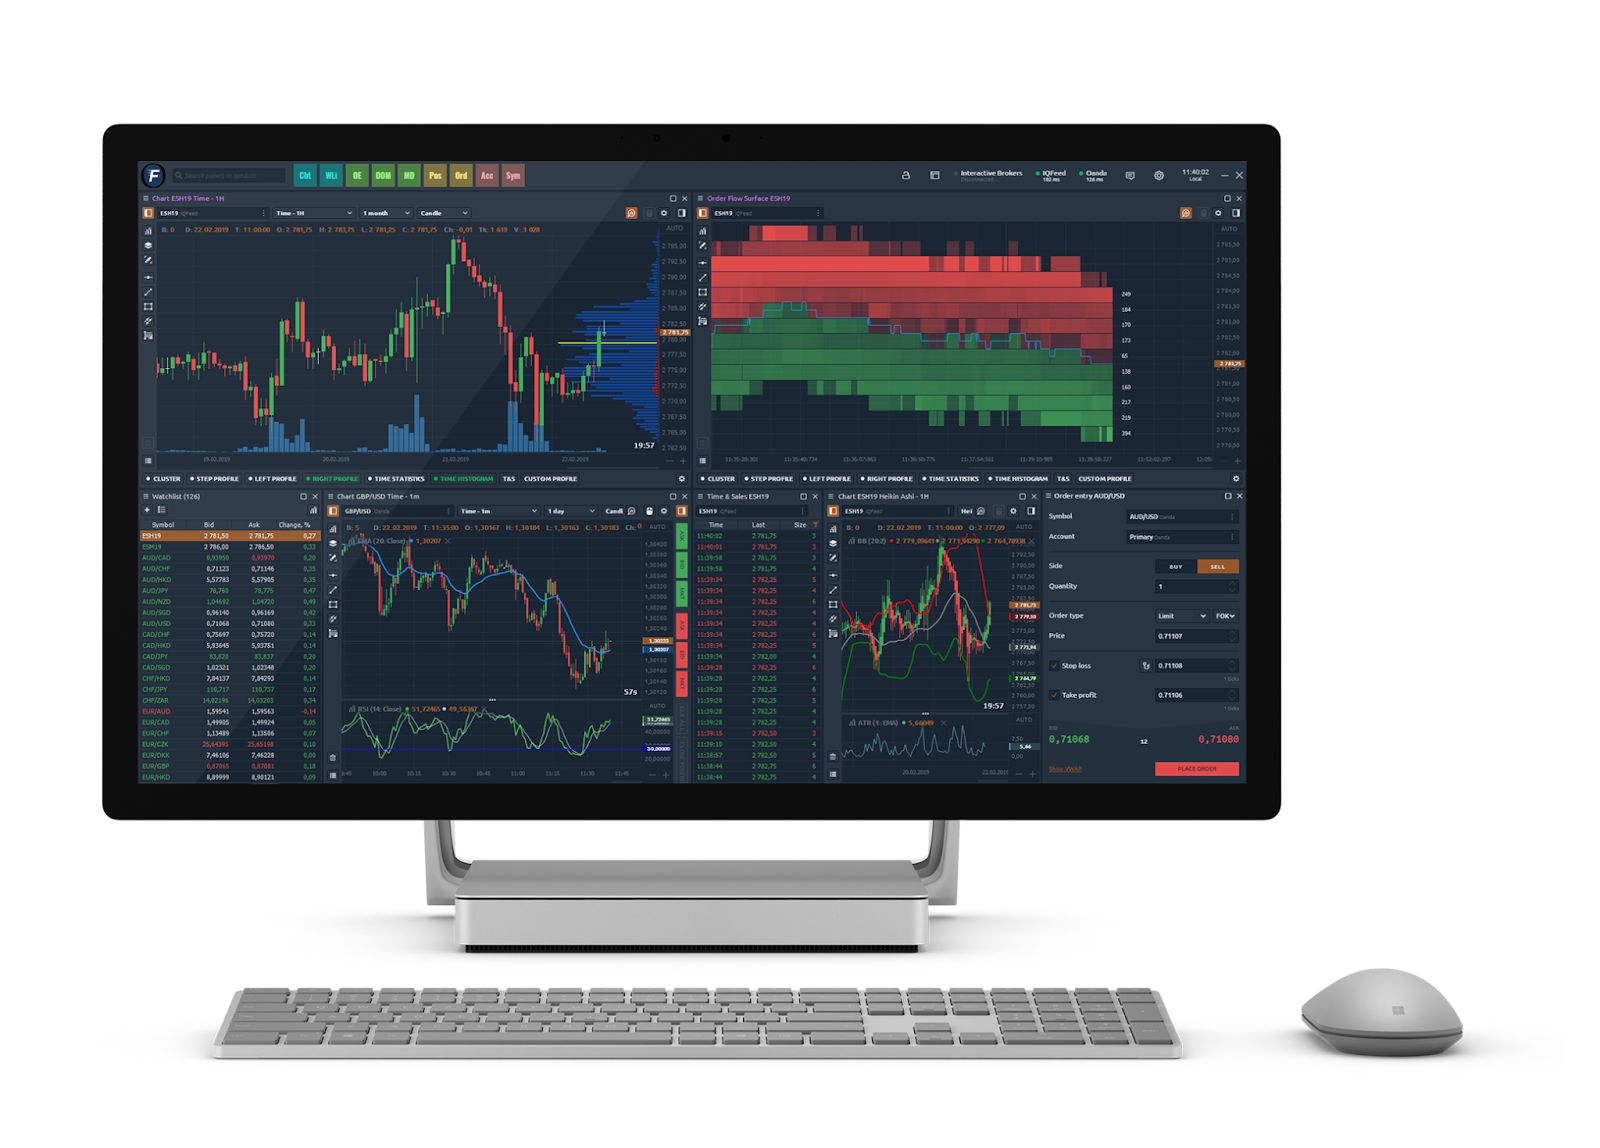
Optimus Flow, powered by the Quantower engine, includes all premium features at no cost for funded Optimus Futures accounts. The platform combines advanced order flow analysis, professional DOM trading, and multi-asset capabilities in an integrated broker platform, eliminating the need for separate platform subscriptions.
Key Features
- Advanced DOM Trading: Ladder-style order entry with one-click execution, bracket orders, and visual stop/target placement
- Footprint Charts: Bid/ask volume at each price level with delta analysis and customizable color schemes for quick visual reads
- Volume Profile: Horizontal volume histograms, POC (Point of Control) identification, value area highlighting, and session volume splits
- Market Depth Visualization: Real-time order book with depth of market ladder trading and position/P&L tracking
- Multi-Asset Trading: Multiple DOM windows for trading multiple instruments simultaneously with synchronized layouts
- Customization: Configurable hotkeys, layout templates, color schemes, and multi-monitor support
- Cross-Platform: Desktop (Windows), web browser, and mobile applications with seamless synchronization
- Direct Execution: Integrated broker platform with Rithmic data feed for low-latency order routing
Pricing
$0 platform fee (included with funded Optimus Futures account). Commission is $0.25 per side. Real-time market data (level 1) is included at no additional cost with 10 trades/month. No monthly subscription fees, no separate platform charges. Compare to standalone Quantower subscriptions: $70/month for premium features.
Best For
Traders who want Quantower's professional order flow tools (advanced DOM, footprint charts, volume profile) without monthly subscription fees, or traders exploring order flow methodology who want full-featured software included with their brokerage account.
5. NinjaTrader Order Flow Plus
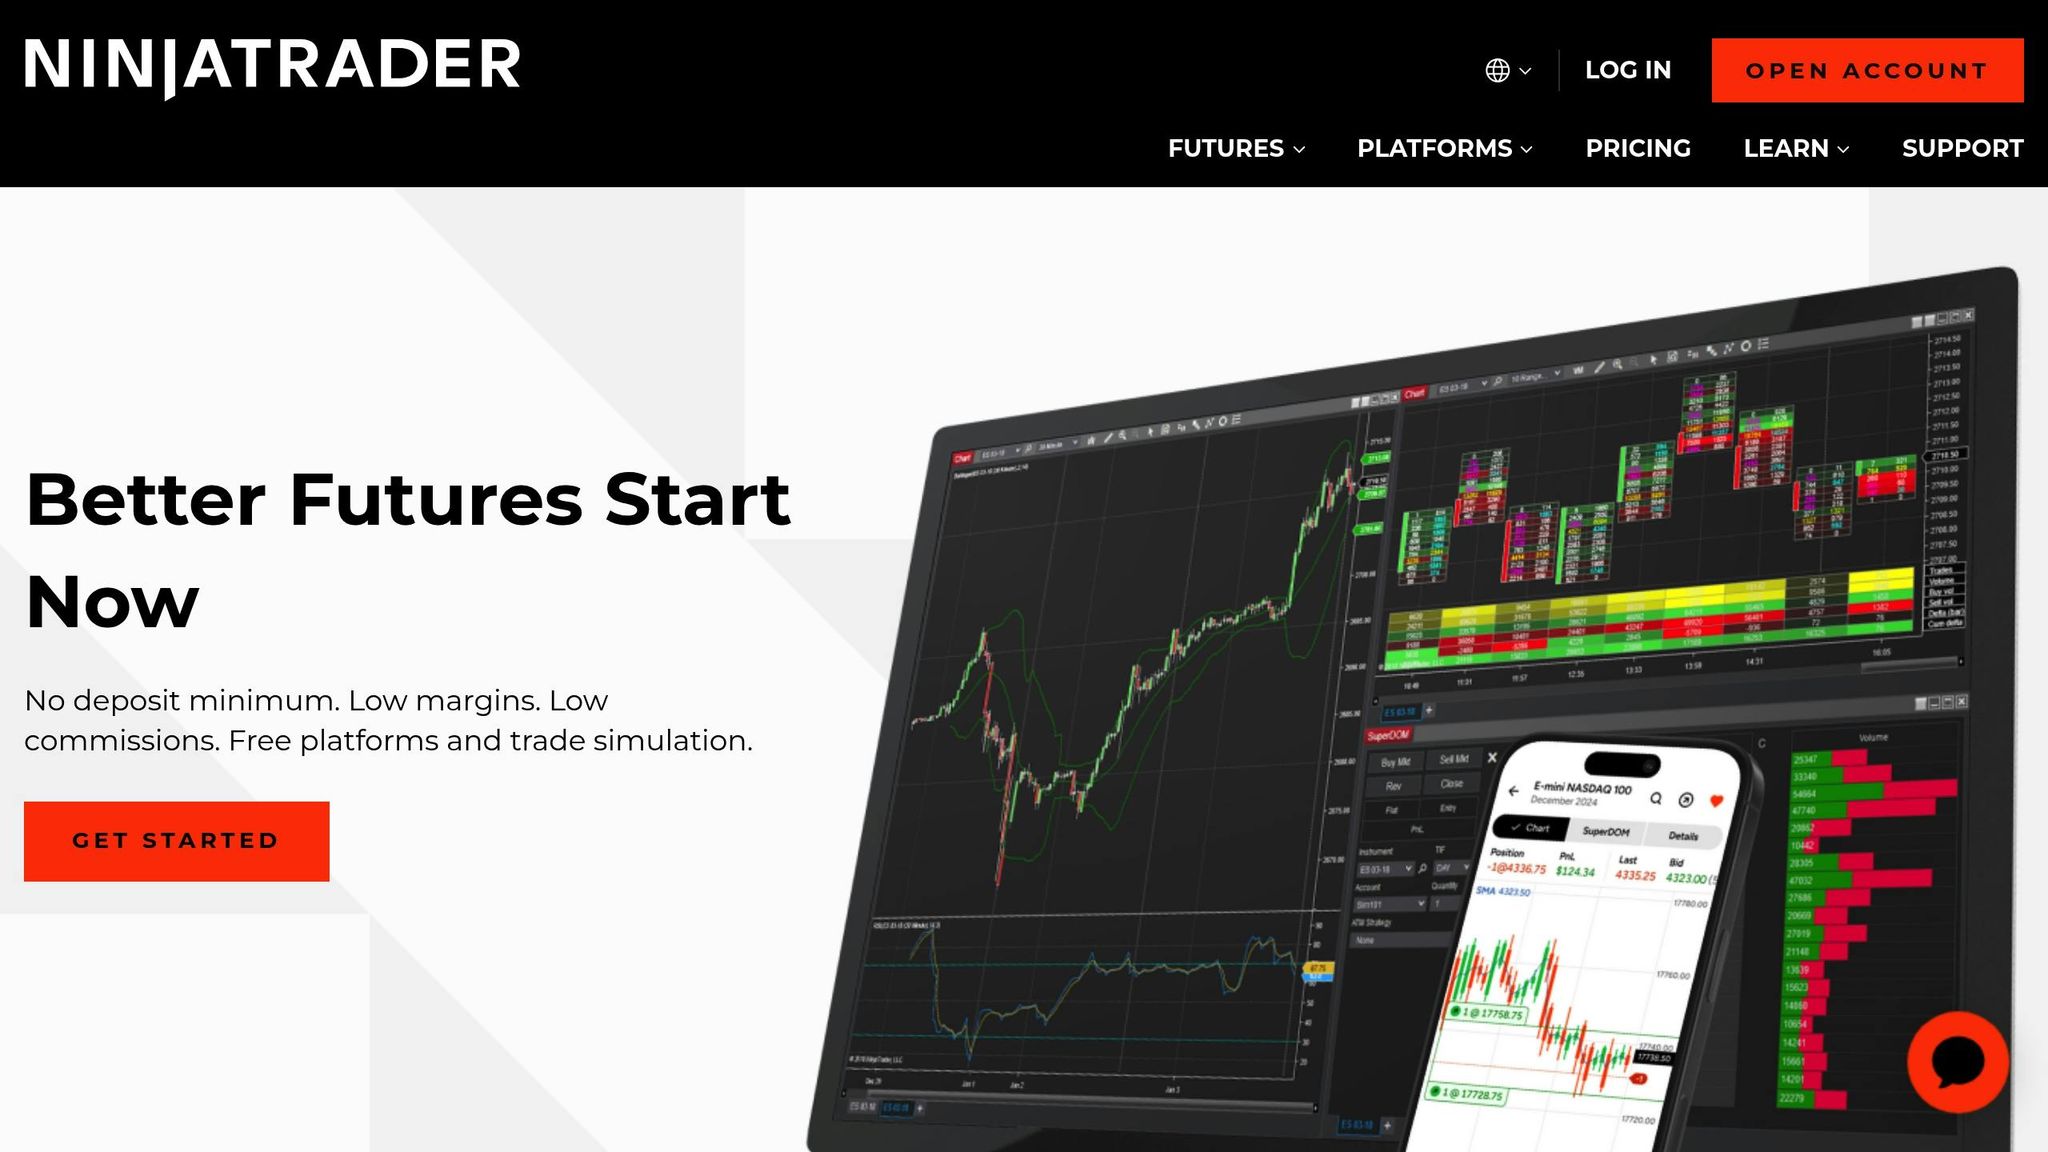
NinjaTrader Order Flow Plus blends detailed order flow analysis with a trading platform built around its SuperDOM interface, delivering the speed and accuracy that futures and options traders rely on for scalping and momentum strategies.
The SuperDOM interface allows for point-and-click order entry while providing a real-time view of market depth. It displays bid and ask quantities at each price level, making it easier to spot large orders. With instant processing of order updates, traders can react to market changes in real-time.
"The SuperDOM point-and-click trading interface is fast and precise and can help you avoid costly order entry price mistakes." - NinjaTrader Team
One standout feature of NinjaTrader is its Advanced Trade Management (ATM), which automates risk management directly within the DOM. Traders can pre-set one-cancels-the-other brackets and trailing stops, reducing the need for manual adjustments during fast-moving market conditions. This automation is particularly helpful for scalpers who need to act quickly. On top of this, the platform offers a suite of advanced tools for deeper analysis.
The Order Flow Plus toolkit includes specialized indicators such as volumetric bars to track buying and selling pressure within each bar and cumulative delta to measure net aggressive orders. The trade detector highlights unusually large orders as they enter the market, while the market depth map visually represents order book imbalances.
For traders focusing on volume profile analysis, NinjaTrader pinpoints where the highest trading activity occurred over specific periods, helping to identify key support and resistance levels with actual volume data. The VWAP (Volume Weighted Average Price) indicator adds another layer of insight, showing the average price weighted by volume throughout the session - an analysis tool often used by institutional traders.
NinjaTrader supports direct market access to major futures exchanges like CME, CBOT, and NYMEX, connecting through various data providers. Its ability to handle high-frequency data ensures smooth performance in active markets such as E-mini futures and crude oil options, where even milliseconds can make a difference.
For those looking to use Order Flow Plus, the features are included at no extra cost for NinjaTrader lifetime license holders. Alternatively, users can subscribe to the add-on for $59 per month.
6. Quantower
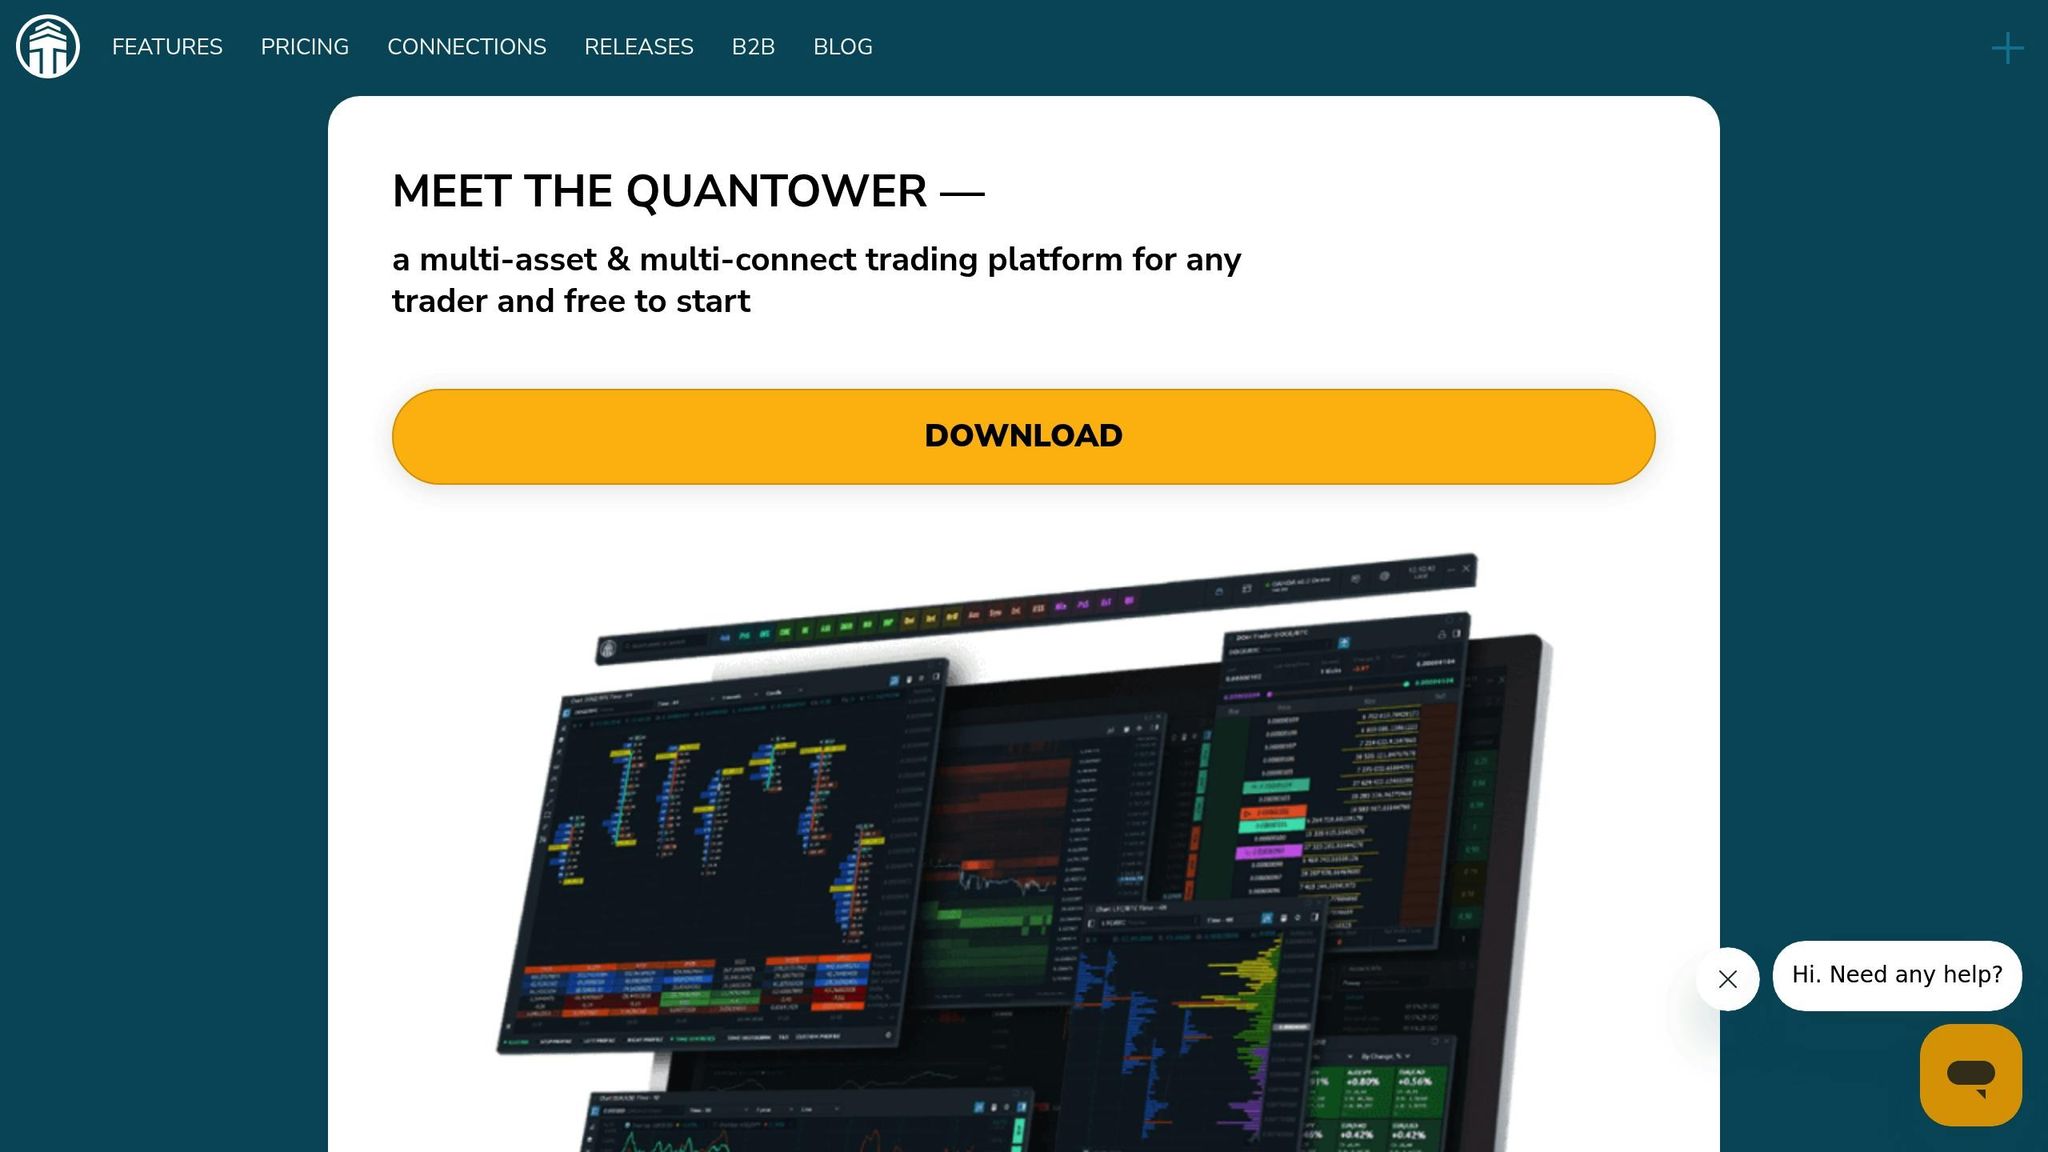
Quantower brings together a multi-asset trading platform that combines order flow tools for futures, options, stocks, and forex, all within a single interface. Its standout feature is the modular design, which lets traders tailor their workspace by adding specific tools they rely on.
One of its key features is the Depth of Market (DOM) interface, offering a real-time view of market depth. The customizable price ladders display bid and ask volumes at each price level, and traders can place orders directly using one-click trading. The DOM also supports bracket orders and OCO (One-Cancels-Other) functionality, enabling traders to set both profit targets and stop-loss levels simultaneously for better risk management.
Quantower's Cluster Chart is a highlight for order flow analysis, breaking down each price bar into volume clusters. This gives traders a detailed view of buying and selling activity within specific price ranges. It’s particularly effective for spotting absorption levels (where large orders are being executed) and imbalance zones (where one side of the market dominates).
The platform also includes advanced visualization tools like the Volume Profile, which shows horizontal volume distribution across price levels, and the Market Profile, which highlights time-based price acceptance areas. The Footprint Chart takes it a step further, showing the volume traded at each price level within individual bars, with color coding to indicate aggressive buying or selling. These tools work hand-in-hand with Quantower’s execution features, helping traders fine-tune their market entries and exits.
Stay online and closer to execution. Choose a VPS location for CME futures, New York markets, London FX, API trading, and more.
Host your platform near the market route that matters.
From $59.99/mo
For traders focused on speed, Quantower delivers high-speed execution, which is critical for scalping strategies. It achieves this through direct connections to major exchanges like CME Group, Eurex, and ICE Futures, ensuring low-latency execution. This is especially important in fast-moving markets like E-mini S&P 500 and crude oil futures, where even a slight delay can make a difference.
The platform’s Smart DOM feature automatically adjusts price levels as the market shifts, keeping orders visible without the need for manual scrolling. It also supports algorithmic order types like Iceberg and TWAP, making it a versatile option for systematic trading.
Quantower operates on a freemium model, offering basic order flow tools for free, while advanced features require a subscription. Pricing starts at $39 per month for additional tools, with professional-level functionality available for $79 per month. Data feed costs are separate and vary by exchange - for example, CME real-time data is approximately $105 per month for non-professional traders. This pricing structure makes Quantower accessible to both beginners and experienced traders.
Another strength of Quantower is its support for multi-monitor setups. Traders can detach and customize trading windows, allowing them to monitor order flow charts, DOM interfaces, and position management tools simultaneously - ideal for staying on top of active markets.
Advantages and Disadvantages
When it comes to order flow trading platforms, each has its own set of strengths and weaknesses, which can influence trading styles, order execution, risk management, and overall performance. Let's break down the key points for each platform.
Bookmap stands out for its heatmap visualization, which provides a clear view of both historical and real-time order flow. This feature delivers a comprehensive market perspective. However, its subscription model may deter casual traders, and the platform's unique visualization style often requires a learning curve to master.
Sierra Chart is known for its stability and extensive customization capabilities. It supports multiple data feeds efficiently, making it a reliable choice for professional traders. On the downside, its interface feels outdated, and the setup process can be more complex compared to newer platforms.
Jigsaw Trading offers speed and a user-friendly interface, making it ideal for traders who prioritize market depth visualization. However, its specialization in order flow tools might feel restrictive for those seeking a broader range of analytical features or trading across multiple asset classes.
NinjaTrader Order Flow Plus integrates seamlessly with NinjaTrader, offering advanced order management tools like the SuperDOM for precise order handling. That said, accessing its more sophisticated features often involves additional licensing fees, which can add to the overall cost.
Quantower provides a modular design that allows for extensive workspace customization. Its freemium model is appealing, and it supports trading across multiple asset classes. However, the platform's extensive feature set might overwhelm traders who prefer simpler tools.
| Platform | Key Strengths | Main Weaknesses | Best For |
|---|---|---|---|
| Bookmap | Heatmap visualization; historical data insights | Higher cost; steep learning curve | Visual learners; swing traders |
| Sierra Chart | Stable and highly customizable | Outdated interface; complex setup | Professional traders; high-volume users |
| Jigsaw Trading | Fast execution; simple interface | Limited analysis features; futures-focused | Scalpers; day traders |
| Optimus Flow | Quantower whitelabel with all premium features; advanced DOM, footprint charts, volume profile included; zero subscription fees; integrated broker platform | Windows-only desktop; requires funded account | Order flow traders wanting professional tools without monthly subscriptions; traders exploring order flow methodology |
| NinjaTrader Order Flow Plus | Advanced order management; NinjaTrader integration | Extra fees for advanced tools | Existing NinjaTrader users |
| Quantower | Modular design; multi-asset support | Overwhelming for beginners; subscription tiers | Multi-market traders; beginners |
Performance also depends on the platform's design. Some systems prioritize low latency for faster order execution, while others may require robust computing power to handle advanced visualizations or integrated tools.
Additionally, most platforms rely on real-time market data, which often requires a separate subscription. This can significantly impact both performance and overall costs, so it's essential to factor in data feed arrangements when choosing a platform.
Ultimately, selecting the right order flow trading software boils down to aligning its features and limitations with your personal trading strategy and goals.
Final Thoughts
When deciding on order flow trading software, it's essential to align your choice with your trading style, level of experience, and budget.
Scalpers and high-frequency traders will find Jigsaw Trading's quick execution and user-friendly interface a strong match. Sierra Chart is another solid option for this group, offering reliability during high-volume trading.
Day and swing traders who prioritize visual analysis might lean toward Bookmap, known for its detailed market insights and access to historical data.
Beginners could explore Quantower's freemium model for a cost-effective start or NinjaTrader Order Flow Plus if they're already familiar with the NinjaTrader platform.
Multi-asset traders may prefer Quantower for its support across various markets or Sierra Chart for its ability to handle multiple data feeds, as discussed earlier.
Order flow traders can take advantage of Optimus Flow, a platform that presents a unique value proposition for traders testing or committed to order flow methodology. As a Quantower whitelabel, it eliminates the typical monthly cost barrier for professional order flow tools. Traders get advanced DOM, footprint charts, and volume profile analysis without separate platform subscriptions.
Keep in mind that budgeting goes beyond the software itself. Real-time data feeds, which are often required, can cost anywhere from $50 to over $200 per month depending on your market coverage. This can significantly influence your overall trading expenses.
Additionally, platforms like Bookmap, with their advanced visualizations, demand higher computing power. In contrast, lightweight tools like Jigsaw Trading can operate smoothly on standard hardware.
To make the best choice, consider testing platforms during trial periods that align with your usual trading hours. This hands-on approach ensures the software meets your specific needs before making a commitment.
FAQs
How do the order flow trading platforms differ in terms of features and pricing?
The order flow trading platforms outlined here differ in their features and pricing, catering to a range of trading preferences and budgets.
- Bookmap: Renowned for its real-time heatmaps and market depth visualization, Bookmap provides tiered pricing options starting at $99 per month or $1,990 annually. It's a great fit for traders who value detailed market data and visualization tools.
- Sierra Chart: This platform stands out for its advanced charting capabilities and customization options. With pricing starting at around $26 per month, it’s a budget-friendly choice for traders who want flexibility and control.
- Jigsaw Trading: Designed with order flow analysis in mind, Jigsaw includes tools like DOM (Depth of Market) and volume profiling. It typically requires a one-time investment of about $297, making it attractive to traders who prefer a single upfront cost.
Each platform has its own strengths, so the right choice depends on your specific trading needs, the features you prioritize, and your budget.
How does the data feed you choose affect the performance and cost of order flow trading software?
The data feed you choose significantly impacts both the efficiency and the cost of your order flow trading software. High-quality, real-time data feeds offer quicker updates and more precise information, enabling traders to analyze order flow accurately and react to market changes as they happen. That said, these premium feeds often come with a hefty price tag, which can add to your trading expenses.
On the flip side, opting for cheaper or free data feeds might help cut costs, but they often lack the speed and detail necessary for thorough order flow analysis. This could result in missed trading opportunities or less informed decisions. To achieve optimal results, traders need to carefully evaluate the advantages of premium data feeds against their budget, aiming to find the right balance between performance and cost.
What is the best order flow trading software for beginners trading multiple asset classes?
For those new to trading and looking to explore various asset classes, Quantower is a standout option. It combines an easy-to-navigate interface with powerful order flow tools, making it approachable for beginners while still offering advanced features that can support your growth as you gain experience.
While platforms like NinjaTrader and TradingView are also well-regarded for their user-friendly design, Quantower sets itself apart with its strong emphasis on order flow analysis - a valuable feature, especially for newcomers venturing into futures and options trading.


