
Looking for the best algorithmic trading software in 2026? Here’s a quick breakdown of three top platforms tailored for traders with different needs:
- NinjaTrader: Ideal for futures traders who need advanced backtesting, deep customization with C#, and portfolio-level analysis. Costs range from $99/month to a $1,499 lifetime license.
- Tradovate: A cloud-based platform focused on simplicity and accessibility, offering JavaScript customization and API-driven features. Pricing includes a free plan or paid options starting at $99/month.
- MetaTrader (MT4/MT5): A go-to choice for Forex traders, offering free access through brokers, multi-timeframe analysis, and a vast library of trading tools in its MQL5 marketplace.
Each platform excels in specific areas, from NinjaTrader’s precision tools to Tradovate’s ease of use and MetaTrader’s strong Forex focus. Choose based on your trading goals, strategy complexity, and technical expertise.
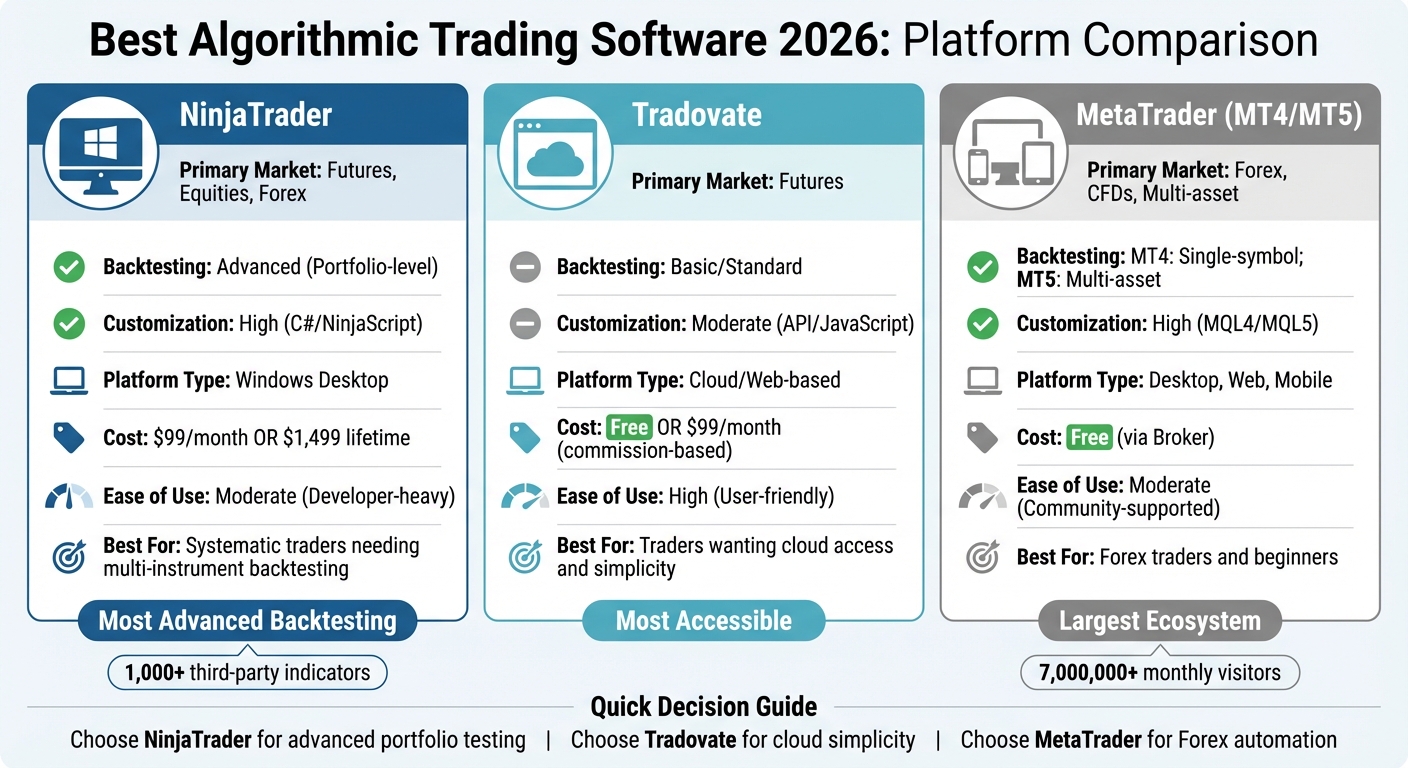
Quick Comparison
| Platform | Primary Market | Backtesting | Customization | Platform Type | Cost |
|---|---|---|---|---|---|
| NinjaTrader | Futures, Equities, Forex | Advanced (Portfolio-level) | High (C#/NinjaScript) | Windows Desktop | $99/month or $1,499 lifetime |
| Tradovate | Futures | Basic/Standard | Moderate (API/JavaScript) | Cloud/Web-based | Free or $99/month |
| MetaTrader | Forex, CFDs, Multi-asset | MT4: Single-symbol; MT5: Multi-asset | High (MQL4/MQL5) | Desktop, Web, Mobile | Free (via Broker) |
For in-depth trading, NinjaTrader’s tools stand out. If simplicity and cloud access matter, Tradovate wins. For Forex automation, MetaTrader remains unmatched.
Algorithmic Trading Software Comparison 2026: NinjaTrader vs Tradovate vs MetaTrader
1. NinjaTrader
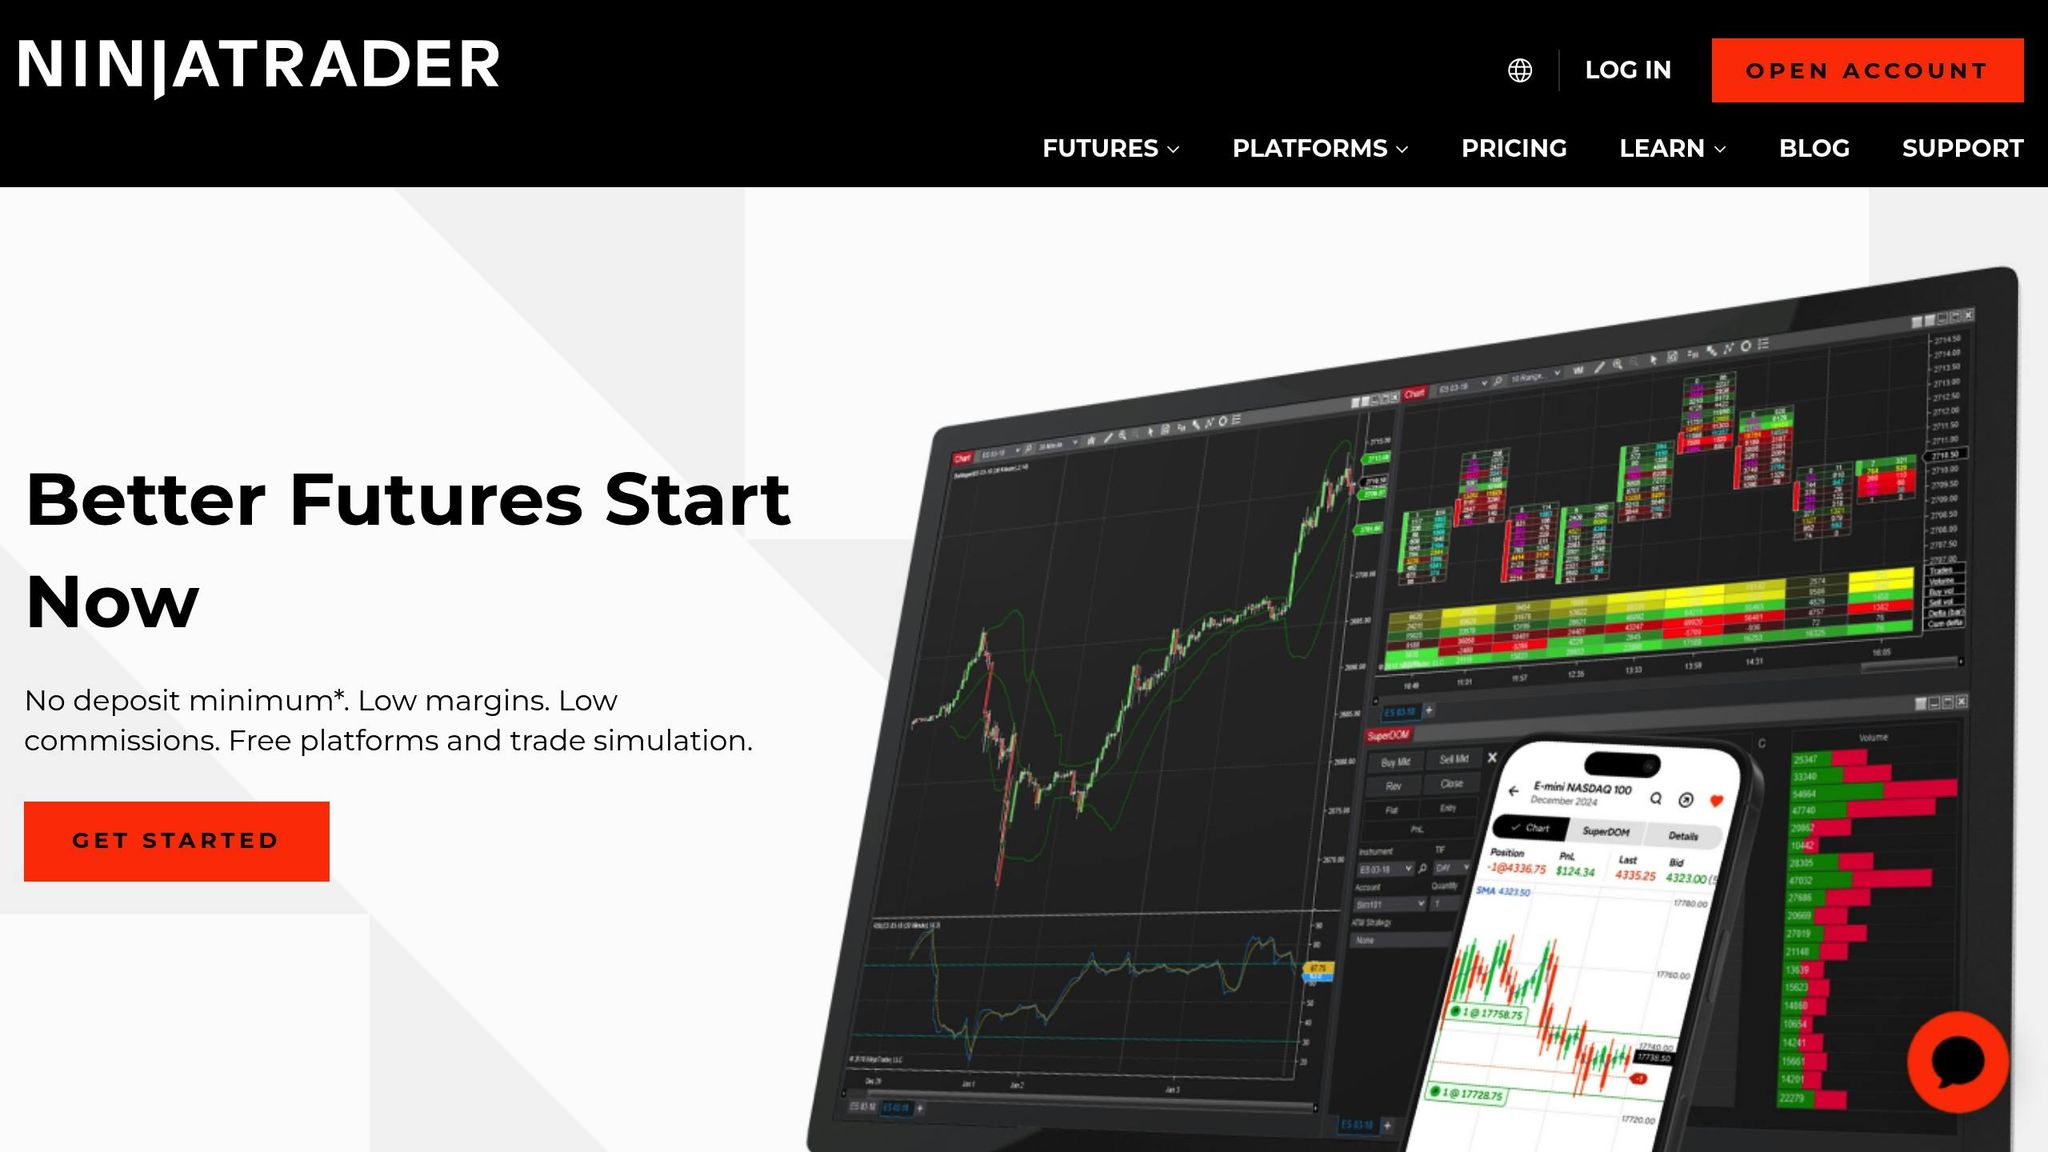
Since its launch in 2003, NinjaTrader has become a go-to platform for futures algorithmic traders. It runs natively on Windows using .NET, while Mac and Linux users can access it through emulators like Parallels or VMware. The basic version of the platform is free, but advanced features such as automation and charting require a paid subscription: $720 per year, $225 per quarter, or a lifetime license for $1,099.
Backtesting Capabilities
NinjaTrader’s Strategy Analyzer stands out for its ability to handle multi-instrument and multi-timeframe backtesting, giving it an edge over platforms limited to single-symbol tests. This tool lets traders account for slippage, commissions, and parameter optimization, helping them refine strategies without falling into the trap of curve-fitting. The platform offers 25 years of historical 1-minute futures data and tick-by-tick data dating back to 2008. Its Market Replay feature allows traders to download historical data and replay it tick-by-tick, simulating live market conditions. This is invaluable for testing execution logic before risking real money.
Customization Options
Built on C#/.NET, NinjaScript provides deep access to key trading elements like balances, positions, orders, and real-time data. This allows traders to create highly detailed and precise systems. For those who don’t code, the platform includes a point-and-click strategy builder, though it’s less flexible than scripting. NinjaTrader also boasts an ecosystem with over 1,000 third-party indicators and automated strategies contributed by developers from more than 150 countries. The desktop interface is fully customizable, letting users tweak colors, fonts, and display layouts to suit their preferences.
Integration with Trading Systems
NinjaTrader excels in seamless integration with brokerage accounts, linking directly to balances, positions, and orders for streamlined, automated strategy execution. The platform supports multiple brokers, including Interactive Brokers, Oanda, and GAIN Capital, and also operates its own brokerage with a minimum deposit requirement of $400. Advanced tools like volumetric bars and market depth analysis give traders a detailed view of real-time buying and selling activity.
Run 24/7 while you sleep. Keep bots, platforms, and trade copiers online on a dedicated VPS.
Low-latency VPS hosting for your trading platform.
From $59.99/mo
Performance Metrics
Precision is key for performance validation, and NinjaTrader delivers with tick-by-tick backtesting. This feature places it alongside platforms like Sierra Chart and MultiCharts, while surpassing others like TradingView that lack this capability. The platform supports portfolio-wide testing and position sizing simulations, moving beyond the limitations of single-instrument analysis. Add-ons like Monte Carlo simulation plugins enable traders to stress-test strategies and assess drawdown risks. With over 100 built-in indicators and the ability to run unlimited replay windows for manual backtesting, NinjaTrader offers a robust toolkit for validating trading strategies.
Next, we’ll take a look at how Tradovate approaches these challenges with its cloud-based platform.
2. Tradovate
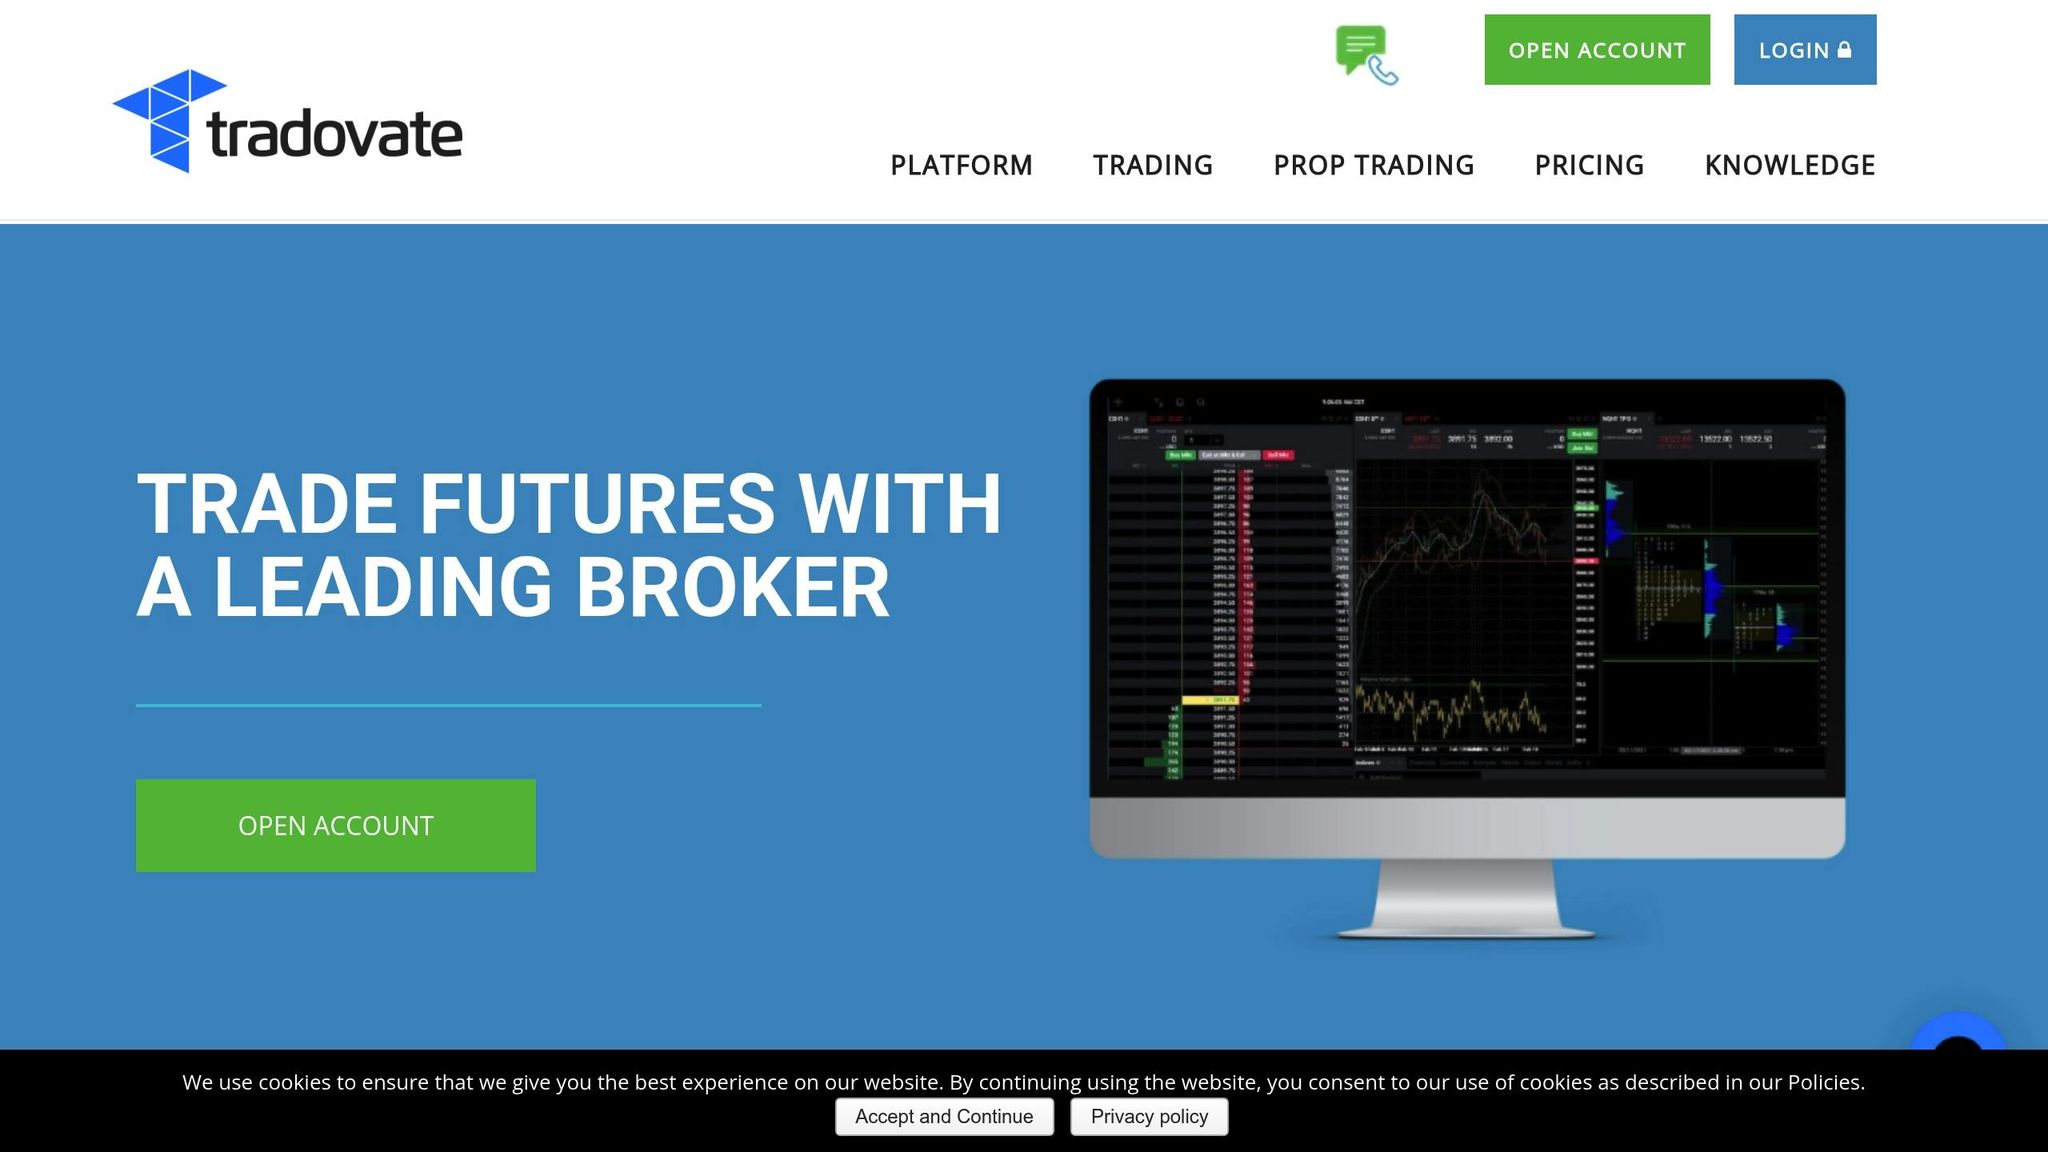
Tradovate is a cloud-based trading platform that operates seamlessly across web browsers and mobile apps, eliminating the need for desktop installations. This design ensures that customizations and workspaces are automatically synced across devices, whether you're using a desktop, Mac, iOS, or Android. Tradovate offers three pricing tiers: a free option with fees of $0.39/$1.29 per micro/standard contract per side, a $99 monthly plan with reduced rates of $0.29/$0.99, and a $1,499 lifetime license with even lower rates of $0.09/$0.59 per side.
Backtesting Capabilities
Tradovate's Market Replay tool is a standout feature for testing trading strategies. This cloud-based tool uses historical tick data and allows traders to replay market conditions at speeds of up to 4x. The server-side functionality is particularly useful for analyzing high-volatility events - like Federal Reserve announcements - directly from any device. Traders can also access unlimited simulation features to refine their strategies before going live. To further support performance analysis, the platform's Performance Center tracks real-time metrics and allows filtering by specific symbols. This helps users identify which strategies are yielding the best results.
Customization Options
Tradovate provides flexibility for traders who want to tailor their experience. Custom indicators can be developed using JavaScript, avoiding the need for proprietary coding languages that might limit versatility. The platform includes a fully modifiable library of indicator code, which can be applied to both charts and the Depth of Market module. For those who prefer no-code solutions, Tradovate integrates with third-party tools like PickMyTrade (around $50 per month), enabling automated TradingView alerts to be sent directly to the broker. Additionally, the platform supports advanced order management with server-side bracket orders (up to 10 levels deep) and offers OCO (One Cancels Other) and OSO (Order Sends Order) types for more precise exit strategies.
Integration with Trading Systems
Tradovate is designed to integrate smoothly with various trading systems, enhancing its functionality. The platform offers a REST API (with OpenAPI/Swagger) and an improved WebSocket streaming service, which will see a 20% speed boost in 2025. These tools support multiple programming languages, including Python and Node.js, and allow up to 5,000 requests per hour with a rate of 80 requests per minute. One of Tradovate's key strengths is its server-side execution, which ensures that automated strategies remain active even during internet outages or device failures. The platform also integrates directly with TradingView and Jigsaw, enabling users to manage orders, positions, and balances within those interfaces. To comply with CME exchange rules, all automated orders must include the isAutomated: true flag.
Performance Metrics
Tradovate's cloud infrastructure supports group trading, enabling traders to apply a single algorithmic order across multiple accounts simultaneously. Full API access to both the simulation environment and Market Replay tool allows for detailed backtesting using historical tick data, minimizing risk to capital. The Performance Center offers real-time monitoring of account metrics and lets users filter data by trading symbol to assess strategy performance. Additionally, the platform's VPS compatibility ensures ultra-low latency execution, making it ideal for high-frequency trading strategies.
Next, we’ll take a closer look at how MetaTrader leverages its established ecosystem and scripting tools for algorithmic trading.
3. MetaTrader
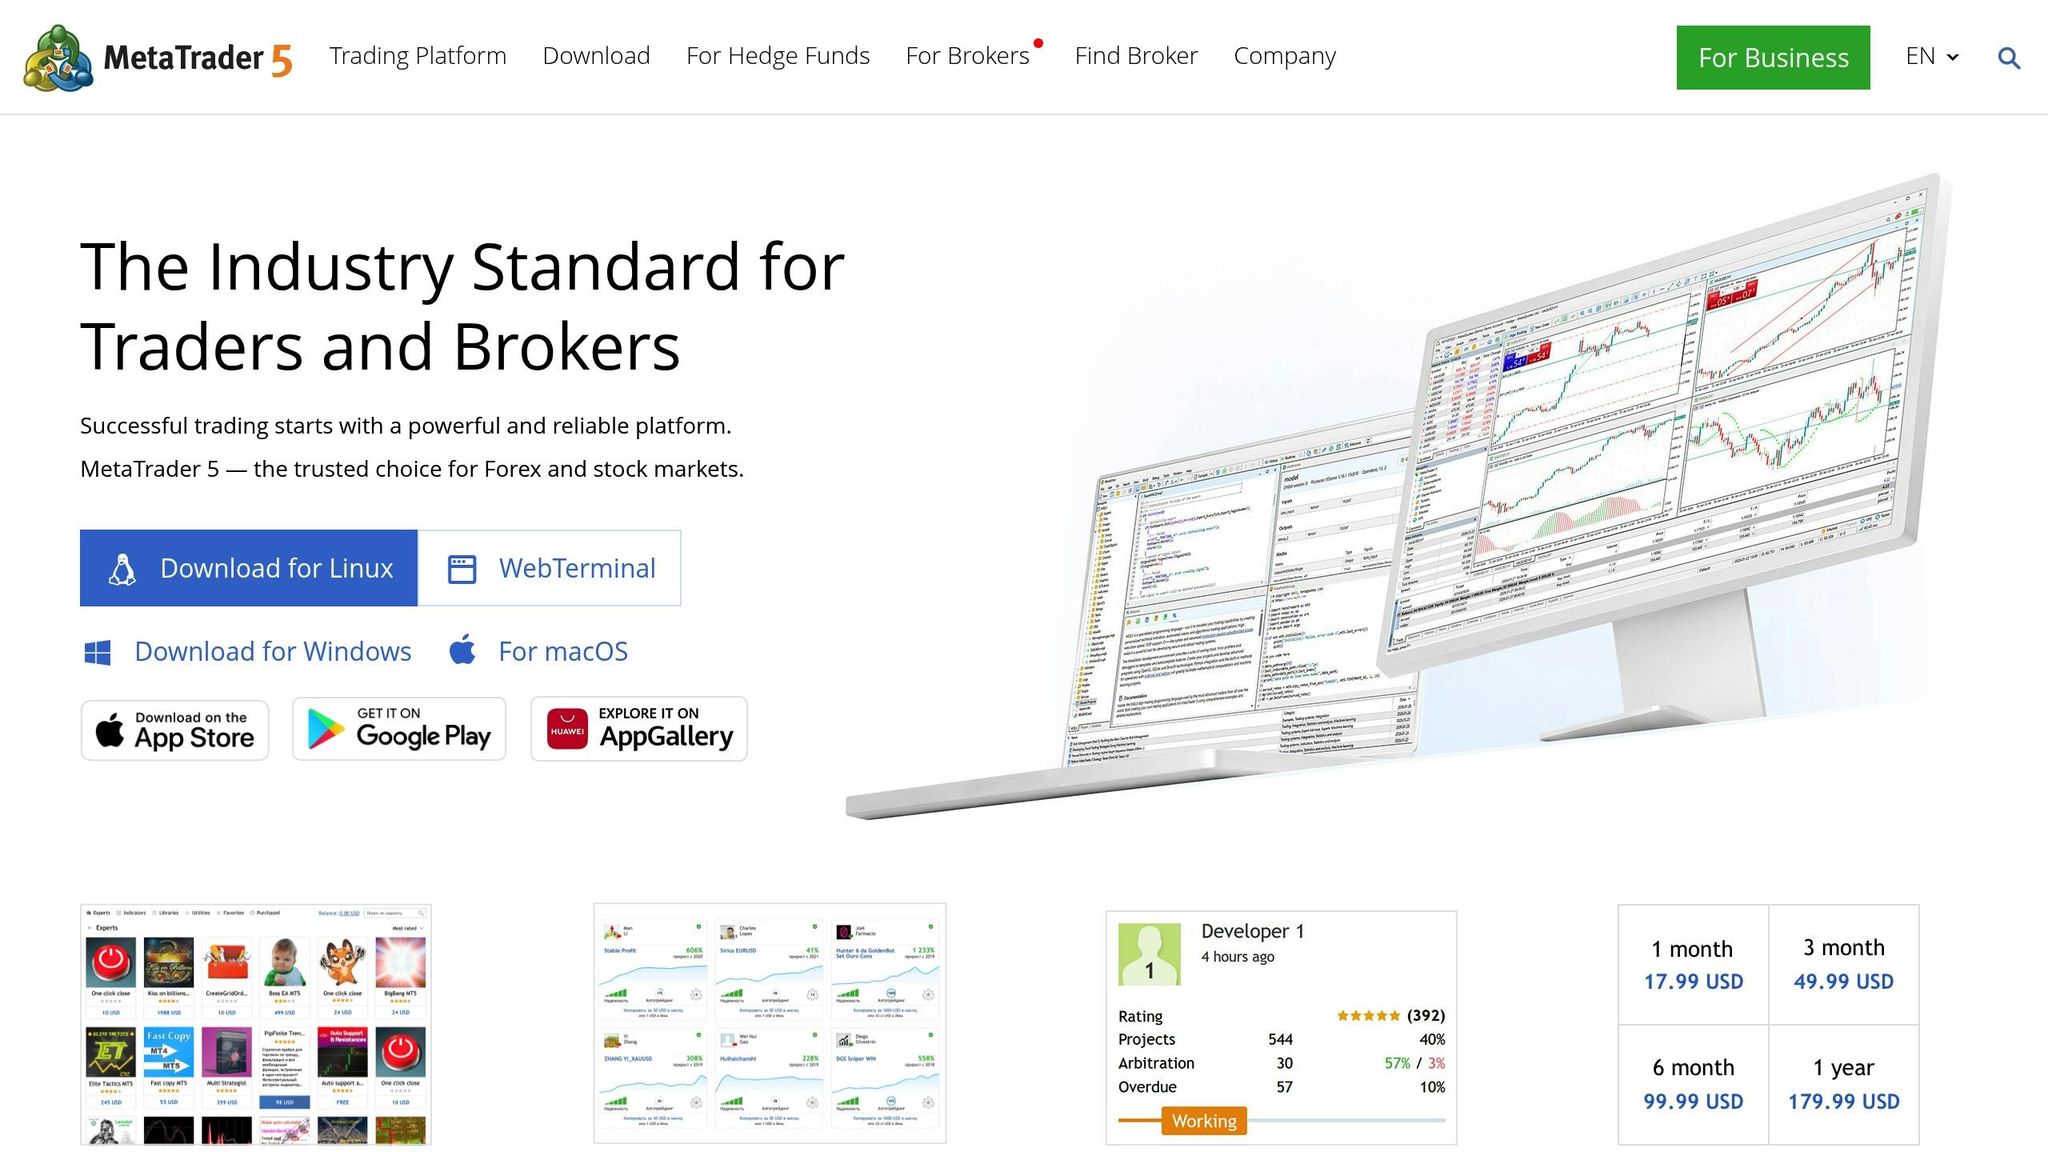
After examining NinjaTrader and Tradovate, it's clear that MetaTrader offers its own set of strengths. MetaTrader 5 (MT5) has become the go-to platform for algorithmic trading in 2026, building on the features of its predecessor. Brokers typically offer the platform free of charge, making it accessible for traders across all experience levels. MT5 provides 21 timeframes and 38 built-in indicators, a noticeable upgrade from MetaTrader 4's 9 timeframes and 30 indicators. The platform's ecosystem thrives, with the MQL5.community attracting over 7,000,000 unique visitors monthly.
Backtesting Capabilities
MetaTrader 5's Strategy Tester offers five modeling modes tailored to various trading strategies. The "Every tick based on real ticks" mode ensures precision for scalping strategies, while modes like "1 minute OHLC" and "Open prices only" allow for quicker testing of long-term approaches. The platform also supports distributed computing through the MQL5 Cloud Network, connecting computers worldwide to cut optimization times from months to hours. Recent updates (Build 5572) have improved ONNX support, speeding up AI model execution on CUDA-enabled GPUs.
The Strategy Tester includes a forward testing feature, splitting historical data into "in-sample" and "out-of-sample" sections to avoid over-optimization. A "Random Delay" mode simulates network latency and dealer execution delays, offering more realistic performance insights. For example, one year of 1-minute EURUSD data takes up about 20.7 MB, while a year of tick data requires roughly 2.41 GB.
Customization Options
The MQL5 programming language uses C++-like syntax, supporting object-oriented programming for faster calculations compared to MQL4. The MetaEditor IDE enhances coding with features like a debugger, compiler, and profiler to identify performance bottlenecks. For those without programming skills, the MQL5 Wizard simplifies the creation of Expert Advisors (EAs) by combining pre-built trading signals, money management, and trailing stop algorithms.
MetaTrader 5 also integrates with Python, enabling traders to leverage libraries like NumPy and SciPy for advanced data analysis and machine learning. The platform supports four application types: Expert Advisors, Custom Indicators, Scripts, and Services. While DLL imports can extend functionality, restrictions apply on remote testing agents for security reasons.
Integration with Trading Systems
MetaTrader's widespread adoption among brokers ensures smooth account integration and fast execution. In February 2026, LMAX Group incorporated MetaQuotes' Ultency system to enhance its institutional services for FX and digital assets. Similarly, Scope Prime integrated the Ultency System into its MT5 infrastructure, aiming to provide enhanced liquidity services.
The platform connects directly to the MQL5.community, where traders can download free code, buy trading robots, or hire developers through the Freelance service. For uninterrupted automated trading, the platform offers Virtual Hosting (VPS) at about $15 per month, ensuring minimal latency to broker servers. While MT4 focuses heavily on Forex, MT5 expands access to stocks, futures, options, and cryptocurrencies.
Performance Metrics
Stay online and closer to execution. Choose a VPS location for CME futures, New York markets, London FX, API trading, and more.
Host your platform near the market route that matters.
From $59.99/mo
The Strategy Tester delivers detailed stats, including profit/loss ratios, Sharpe ratio, expected payoff, and 2D/3D optimization visualizations. Its multi-threaded engine supports multi-currency backtesting, allowing EAs to analyze and trade multiple instruments simultaneously. Testing agents automatically enter standby mode for 5 minutes after completing a task to prevent delays for subsequent operations.
For extended historical testing, users must adjust the "Max bars in chart" setting to "Unlimited" in the options menu (Ctrl+O). To enhance security, testing agents operate in a "sandbox" environment, ensuring that EX5 files (EAs) are not saved to hard disks. Visual testing allows traders to observe trades executing on historical charts in real-time, making it easier to debug EA logic and evaluate custom indicators.
Below, we compare the pros and cons of these platforms to help you determine which one best suits your algorithmic trading needs.
Pros and Cons Comparison
Each trading platform has its strengths, catering to different needs and trading styles. NinjaTrader shines for systematic traders who require portfolio-level backtesting across multiple instruments - a feature missing in the basic version of MetaTrader. Adrian Reid, Founder of Enlightened Stock Trading, highlights this advantage:
"NinjaTrader is the more capable platform if you're serious about systematic backtesting and want more speed, control, and realism".
That said, NinjaTrader's advanced capabilities come with a hefty price tag: $99 per month or $1,499 for a lifetime license.
On the other hand, MetaTrader dominates the Forex trading space, thanks to its extensive ecosystem. Ryan Peterson from Benzinga emphasizes its popularity:
"MetaTrader 4 (MT4) remains one of the most widely used platforms for algorithmic forex trading... offering scripting capabilities through the MQL language".
IC Markets, a broker supporting MetaTrader, boasts a 4.8/5 rating on Trustpilot from nearly 50,000 reviews, showcasing its reliability for automation. However, MT4's single-symbol backtesting is a limitation for traders managing diversified portfolios. Adrian Reid cautions:
"MetaTrader 4 (MT4) is lightweight and useful for Forex automation but lacks critical portfolio-level and equity market features needed for serious systematic traders".
Meanwhile, Tradovate offers a simpler, cloud-based solution that eliminates technical hurdles. Unlike NinjaTrader and MetaTrader, which often require Windows emulators for Mac users, Tradovate provides seamless browser access. Its API-centric design is a draw for developers creating custom algorithms, but it lacks the extensive pre-built tools available in MetaTrader's MQL5 marketplace. For non-coders, MetaTrader's library of automated solutions is a major advantage.
Platform Comparison Table
| Platform Comparison | NinjaTrader | Tradovate | MetaTrader (MT4/MT5) |
|---|---|---|---|
| Primary Market | Futures, Equities, Forex | Futures | Forex, CFDs, Multi-asset (MT5) |
| Backtesting | Advanced (Portfolio-level) | Basic/Standard | MT4: Single-symbol; MT5: Multi-asset |
| Customization | High (C# / NinjaScript) | Moderate (API-focused) | High (MQL4/MQL5) |
| Platform Type | Windows Desktop | Cloud/Web-based | Desktop, Web, Mobile |
| Cost | $99/month or $1,499 lifetime | Commission-based | Free (via Broker) |
| Ease of Use | Moderate (Developer-heavy) | High (User-friendly) | Moderate (Community-supported) |
The best platform for you depends on your priorities. If you're testing multi-instrument strategies, NinjaTrader's Strategy Analyzer is a strong choice. Forex traders will appreciate MetaTrader's zero platform fees and large online marketplace for trading tools. For those who value simplicity and browser-based access, Tradovate's user-friendly design removes many technical barriers.
Conclusion
This analysis breaks down key differences in backtesting, customization, and integration across various algorithmic trading platforms. The best choice ultimately depends on factors like your trading experience, market focus, and technical know-how. For those just starting out, MetaTrader 4 or 5 stands out with its extensive library of Expert Advisors and a strong community - plus, no platform fees to worry about.
Steven Hatzakis, Global Director of Online Broker Research at ForexBrokers.com, supports this view:
"The best algorithmic trading software for beginners is the MetaTrader platform suite."
For futures traders who need advanced tools, NinjaTrader offers portfolio-level backtesting and analysis. However, it comes at a premium, with pricing set at $99/month or a one-time fee of $1,499 for lifetime access.
If mobility and API-driven flexibility are priorities, Tradovate delivers a cloud-based solution tailored for active retail traders.
Regardless of your expertise, testing strategies on demo accounts is a must. This allows you to validate performance and ensure the platform meets your trading needs before committing to a paid subscription. Always confirm that your chosen platform aligns with your strategy and execution requirements.
FAQs
Which platform is best for my market (futures vs. forex vs. multi-asset)?
When choosing a trading platform, the best option often depends on the type of market you’re focusing on:
- Futures traders might prefer platforms like NinjaTrader or Tradovate. These platforms excel in offering advanced automation features and low-latency execution, which are crucial for this market.
- For forex trading, MetaTrader 4 (MT4) remains a favorite. Its lightweight design and robust automation tools make it a go-to choice for many forex traders.
- If you’re dealing with multiple asset types, platforms such as NinjaTrader or Quantower provide broad asset support. They also stand out with advanced features like backtesting and automation, catering to traders who need versatility and precision.
What backtesting features matter most for avoiding overfitting?
Key elements of backtesting to steer clear of overfitting include precise slippage and fill models, maintaining high data quality, ensuring results can be reproduced, and covering a wide range of markets. These factors work together to create simulations that mirror real trading conditions, allowing strategies to target genuine market trends instead of random fluctuations.
Do I need coding skills to automate strategies on these platforms?
In 2026, algorithmic trading platforms are designed to accommodate both tech-savvy programmers and those without any coding experience. If you know coding languages like Python or C++, you can tailor highly specific and advanced trading strategies. However, for non-coders, many platforms provide user-friendly features like visual tools, pre-built strategies, and drag-and-drop interfaces. These make it simple to automate trading strategies, test ideas on historical data, and execute trades. Meanwhile, experienced coders can dive into more detailed customization to fine-tune their approach.


