
Understanding tick values is essential for trading CME futures. A tick is the smallest price movement a contract can make, and each tick has a dollar value that varies by contract. These values determine your profits and losses with every price change. Here’s a quick breakdown:
- E-mini S&P 500 (/ES): Tick size = 0.25 points, Tick value = $12.50
- Micro E-mini S&P 500 (/MES): Tick size = 0.25 points, Tick value = $1.25
- Crude Oil (CL): Tick size = $0.01, Tick value = $10.00
- 10-Year T-Notes (ZN): Tick size = 1/64 (0.015625), Tick value = $15.625
- Euro FX (6E): Tick size = $0.0001, Tick value = $12.50
Why It Matters:
- Profit/Loss Calculations: Know how much you gain or lose per tick.
- Margin Requirements: Tick values influence the capital needed to trade.
- Risk Management: Helps you set stop-loss levels and position sizes.
Quick Tip for Calculations:
Profit/Loss = Tick Value × Tick Movement × Number of Contracts.
For example, if crude oil moves 40 ticks ($0.40), and the tick value is $10, your profit/loss is 40 × $10 = $400 per contract.
Reference Table for Popular CME Contracts

| Contract | Symbol | Tick Size | Tick Value | Contract Size |
|---|---|---|---|---|
| E-mini S&P 500 | ES | 0.25 | $12.50 | $50 × Index Value |
| Micro E-mini S&P 500 | MES | 0.25 | $1.25 | $5 × Index Value |
| Crude Oil | CL | $0.01 | $10.00 | 1,000 barrels |
| 10-Year T-Notes | ZN | 1/64 | $15.625 | $100,000 |
| Euro FX | 6E | $0.0001 | $12.50 | 125,000 euros |
This cheat sheet simplifies calculations and helps you trade confidently. Dive into the article for detailed examples and strategies.
Basic Concepts Behind Tick Values
Tick size, tick value, and contract specifications are the key components that determine the financial impact of each price movement in futures trading.
How CME Defines Tick Sizes and Tick Values
The Chicago Mercantile Exchange (CME) sets tick sizes based on the underlying asset, the size of the contract, and market dynamics. These tick sizes are designed to ensure sufficient liquidity and maintain tight bid-ask spreads, which create a smooth trading environment for all participants [1].
Several factors come into play when determining tick sizes. For instance, in equity index futures like the E-mini S&P 500, the tick size is 0.25 index points. This level of granularity supports precise price discovery in a highly active market. On the other hand, commodity contracts, such as NYMEX WTI Crude Oil, use a tick size of $0.01. This offers the precision needed for contracts covering 1,000 barrels of crude oil [1].
Tick value is calculated by multiplying the contract size by the smallest allowable price movement (tick size). This ensures that the risk and reward associated with each contract remain proportional. For example, the Euro FX Futures (6E) has a contract size of 125,000 euros and a tick size of $0.00005 per euro, resulting in a tick value of $6.25 [4].
Treasury futures further illustrate how contract specifications influence tick values. Most CBOT U.S. Treasury futures have a face value of $100,000 at maturity, except for 2-year and 3-year contracts, which are set at $200,000 [3]. Here’s a table summarizing tick values for these contracts:
| Contract | Face Amount | Minimum Tick | Minimum Tick Value |
|---|---|---|---|
| 2-Year T-Note | $200,000 | 1/8 of 1/32nd | $7.8125 |
| 3-Year T-Note | $200,000 | 1/8 of 1/32nd | $7.8125 |
| 5-Year T-Note | $100,000 | 1/4 of 1/32nd | $7.8125 |
| 10-Year T-Note | $100,000 | 1/2 of 1/32nd | $15.625 |
| T-Bond | $100,000 | 1/32nd | $31.25 |
With these parameters, traders can easily calculate the financial impact of price movements.
Calculating Profit and Loss Using Tick Values
Once you understand tick sizes and values, calculating profit or loss becomes straightforward. The formula involves multiplying the dollar value of a one-tick move by the total ticks the contract has moved since purchase [5].
For example, let’s say a trader buys one WTI Crude Oil contract at $53.60, and the price rises to $54.00. The price increase of $0.40 corresponds to 40 ticks ($0.40 ÷ $0.01 per tick). With each tick valued at $10, the total profit is calculated as:
40 ticks × $10 per tick = $400 [5].
For multiple contracts, simply multiply this result by the number of contracts held.
Tick Values and Margin Requirements
Tick values also play a critical role in determining margin requirements and shaping trading strategies. Exchanges consider tick values when setting initial and maintenance margin levels to account for the daily volatility of each contract.
Contracts with higher tick values generally require larger margin deposits. For example, the 30-Year Treasury Bond, with its $31.25 tick value, demands a higher margin than the Micro E-mini S&P 500, which has a tick value of just $1.25.
Tick sizes also influence risk management and position sizing. If your risk tolerance allows for a $500 loss per trade, you could handle a 40-tick move against your position in an E-mini S&P 500 contract ($500 ÷ $12.50 = 40 ticks). However, for the 30-Year Treasury Bond, your position could only withstand a 16-tick move ($500 ÷ $31.25 = 16 ticks).
To avoid margin calls, ensure your tick value exposure aligns with your account size and risk tolerance. Proper planning helps manage potential losses and keeps your trading strategy on track.
CME Futures Tick Values Reference Table
The table below pulls together the essential tick values for some of the most popular CME futures contracts. It’s designed to help you quickly reference key details for your trading calculations and strategies.
Popular CME Futures Contracts
The CME offers a wide range of futures contracts, covering equity indices, commodities, currencies, and Treasury bonds. Each contract’s specifications play a crucial role in determining your trading approach and managing risk.
Among these, E-mini S&P 500 futures (/ES) stand out as a top choice for traders. With an average daily volume of 1.81 million contracts in 2023 [2], they provide tight spreads and ample liquidity – ideal for active trading.
Here’s a handy reference table for the most actively traded CME futures contracts:
| Contract | Symbol | Exchange | Contract Size | Tick Size | Tick Value |
|---|---|---|---|---|---|
| E-mini S&P 500 | ES | CME | $50 × Index Value | 0.25 | $12.50 |
| Micro E-mini S&P 500 | MES | CME | $5 × Index Value | 0.25 | $1.25 |
| E-mini Nasdaq-100 | NQ | CME | $20 × Index Value | 0.25 | $5.00 |
| E-mini Dow ($5) | YM | CBOT | $5 × Index Value | 1.0 | $5.00 |
| E-mini Russell 2000 | RTY | CME | $50 × Index Value | 0.1 | $5.00 |
| Crude Oil | CL | NYMEX | 1,000 barrels | $0.01 | $10.00 |
| Gold | GC | COMEX | 100 troy ounces | $0.10 | $10.00 |
| Euro FX | 6E | CME | 125,000 euros | $0.0001 | $12.50 |
| 10-Year T-Notes | ZN | CBOT | $100,000 | 1/64 (0.015625) | $15.625 |
| 5-Year T-Notes | ZF | CBOT | $100,000 | 1/128 (0.0078125) | $7.8125 |
| 30-Year Treasury Bond | ZB | CBOT | $100,000 | 1/32 | $31.25 |
The Micro E-mini contracts are particularly appealing to smaller traders. These contracts are one-tenth the size of their E-mini counterparts [2], allowing retail traders to access major indices without needing the capital required for larger contracts.
Meanwhile, currency futures like Euro FX (6E) rely on decimal-based tick sizes, while Treasury futures use fractional pricing. For example, the 10-Year T-Note moves in 1/64ths, and the 30-Year Treasury Bond operates on 1/32nds, reflecting the traditional pricing style of the bond market.
How to Use the Reference Table
This table is a practical tool for profit/loss calculations, position sizing, and risk management. Start by identifying the contract you’re trading and note its tick value in the last column.
- Profit and Loss Calculations: Multiply the tick value by the number of ticks gained or lost. For instance, a 30-point move (120 ticks) in the E-mini S&P 500 results in a profit or loss of $1,500 per contract (120 × $12.50 = $1,500) [2].
- Position Sizing: Knowing the tick value simplifies risk assessment. If your risk tolerance is $500 per trade, you can calculate the maximum ticks you can afford to lose. For E-mini S&P 500 futures, this would be 40 ticks ($500 ÷ $12.50 = 40 ticks), equivalent to 10 index points (40 × 0.25 = 10 points).
- Contract Value and Market Exposure: Understanding the contract size helps you gauge your exposure. For example, if crude oil is trading at $75 per barrel, one CL contract represents $75,000 worth of oil (1,000 barrels × $75). A 50-tick move from $75.00 to $75.50 would translate to a $500 gain or loss per contract (50 × $10).
The exchange column is also key, as it indicates where each contract trades. This can affect trading hours and holiday schedules, both of which are important for planning your trades. Additionally, the contract size influences margin requirements – larger contracts typically require more margin, while Micro contracts offer similar market exposure with lower capital needs.
This table is a solid starting point for your trading calculations and strategies. Use it to streamline your approach to profit/loss scenarios, position sizing, and overall market exposure.
Practical Checklist for Tick Value Calculations
Working out profits, losses, and margin requirements doesn’t have to be complicated. With a clear, step-by-step process, you can avoid errors and make smarter trading choices. Here’s a practical guide to help you stay on track.
Checklist for Profit/Loss Calculations
To calculate your trade results, start by gathering the essential details about your contract. The CME Futures reference table is a helpful resource for this.
"To determine the profit and loss potential for each contract, one must have a solid grasp of contract size, tick size, current trading price, and what you bought or sold the contract for" [5].
Here’s how to calculate profit or loss:
- Identify the tick value from the reference table. This tells you how much money you gain or lose with each tick movement.
- Measure the price movement in ticks. Divide the price change by the tick size to get the total tick movement.
- Use the formula: Tick Value × Tick Movement × Number of Contracts [6].
Double-check your math before making decisions. Tick sizes and values can vary between contracts, so it’s crucial to verify these details for accuracy. Remember, the same formula applies to both gains and losses.
Checklist for Margin Requirement Calculations
Understanding margin requirements is essential for avoiding margin calls or unexpected liquidations.
Start by identifying the initial margin requirement for your contract. This is the amount CME Clearing needs to open a position, though your broker might ask for more [7]. Then, check the maintenance margin, which is the minimum balance you must maintain to keep your position open.
Here’s how to calculate your total margin exposure:
- Multiply the initial margin per contract by the number of contracts you plan to trade.
- Ensure your account balance exceeds this amount before entering a trade.
Keep a buffer in your account, as margin requirements can increase during volatile markets [7].
"If funds drop below the maintenance margin, a margin call may be issued, the position may be reduced, or the position may be liquidated" [7].
It’s also important to remember that futures margin isn’t a down payment, and you don’t own the underlying commodity [7]. Instead, it’s a performance bond to ensure you can meet your obligations.
Example Tick Value Calculations
Let’s go through a few examples to see how these calculations work with different CME contracts.
- E-mini S&P 500 Single Contract: Suppose you buy one contract, and the price moves 5 ticks in your favor. With a tick value of $12.50, your profit is 5 ticks × $12.50 = $62.50 [6].
- E-mini S&P 500 Multiple Contracts: If you trade 3 contracts and the price moves 5 ticks favorably, your profit becomes (5 ticks × $12.50) × 3 contracts = $187.50 [6].
- Larger Price Movements: For a 30-point move in the E-mini S&P 500, which equals 120 ticks (30 ÷ 0.25), the profit for one contract is 120 ticks × $12.50 = $1,500.00.
- Currency Futures: Euro FX futures move in $0.0001 increments with a tick value of $12.50. A 50-tick move (0.0050) in your favor on one contract results in 50 ticks × $12.50 = $625.00.
- Treasury Futures: The 10-Year T-Note has a tick value of $15.625 and moves in 1/64ths. An 8-tick move (8/64ths or 1/8th point) in your favor gives you 8 ticks × $15.625 = $125.00 per contract.
With time and practice, these calculations will feel more intuitive.
"Before trading, understand how price fluctuations and market volatility affect the value of your open trading position" [5].
sbb-itb-7b80ef7
Trading with QuantVPS
In the fast-paced world of futures trading, where every millisecond can mean the difference between profit and loss, your technology setup plays a crucial role. Tick-based trading, especially with CME contracts, demands lightning-fast execution because price changes happen in the blink of an eye. Using low-latency VPS solutions like QuantVPS can make your tick-based profit and loss calculations more precise.
QuantVPS for Real-Time Tick Monitoring
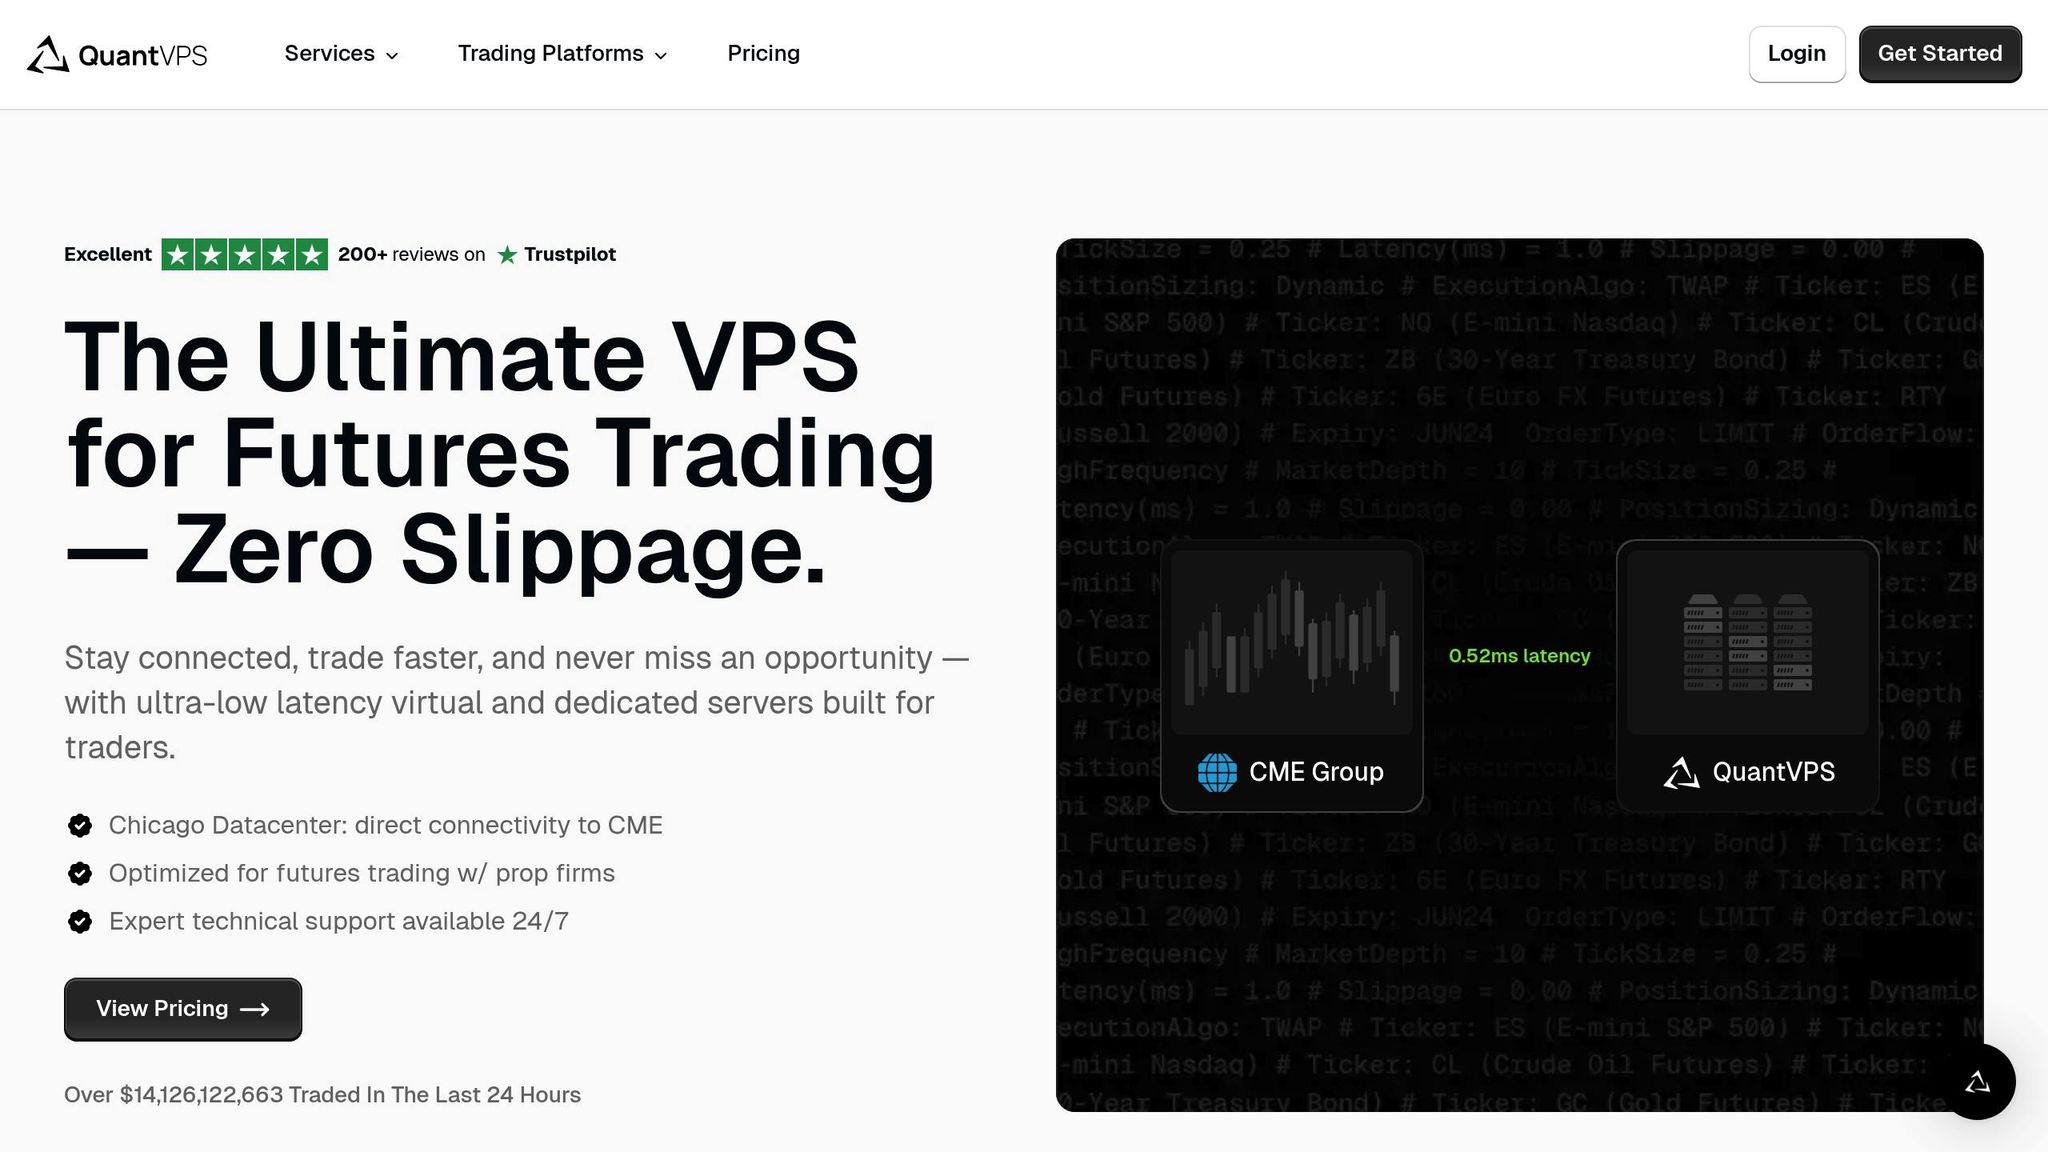
Capturing every price movement in real time requires ultra-low latency connections. QuantVPS delivers latency as low as 0.5 milliseconds to the CME[9].
"Our Chicago datacenter provides ultra-low latency (<0.5ms) directly to the CME exchange, enabling faster futures trade execution and significantly minimizing slippage." – QuantVPS[9]
Strategically located servers near the CME Group ensure that data travels quickly, allowing you to receive tick data almost instantly. This speed is a game-changer when monitoring multiple contracts or running automated strategies that rely on accurate tick calculations.
QuantVPS has deployed over 300,000 trading VPS systems, showcasing its expertise in high-frequency trading environments[8]. The platform uses enterprise-grade processors, NVMe storage, and ample RAM to ensure that data and orders are processed without delay[9]. Plus, with a 100% uptime guarantee, you can trust that your tick monitoring will remain uninterrupted – even during critical trading moments. For instance, missing a single tick while tracking the E-mini S&P 500 could mean a potential profit or loss of $12.50.
With reliable real-time data, you can set up your VPS environment to take full advantage of these speed benefits.
Setting Up a QuantVPS Environment
To get the most out of QuantVPS, you’ll want to optimize your setup for peak trading performance and accurate tick calculations. Start by choosing a plan that matches your trading needs, as QuantVPS offers options tailored to various charting and trading requirements[8].
For reduced latency, select a Chicago-based VPS, which offers a direct connection to exchanges like the CME[10]. Once your VPS is activated, install your preferred trading platform. QuantVPS supports popular platforms like NinjaTrader, Tradovate, and TradeStation[8], all of which display real-time tick data essential for your trading strategies.
To further enhance performance, disable unnecessary Windows services, adjust visual settings to prioritize processing power, and schedule restarts during non-trading hours. Finally, test your latency to confirm you’re achieving the promised sub-0.5ms connection to the CME[9].
QuantVPS for Algorithmic Trading
Algorithmic trading strategies rely on consistent tick data and precise timing for execution. QuantVPS offers direct market access, ensuring high-frequency trades are executed with minimal delay[9].
"Orders transmit directly to the CME Group exchange, minimizing delays and reducing slippage for optimal futures trade execution." – QuantVPS[9]
With premium network providers and optimized routing, QuantVPS ensures the fastest data delivery to the exchange. This allows algorithms to process tick values and execute trades in microseconds. For traders managing multiple strategies, the VPS Ultra plan provides 24 cores and 64GB of RAM, delivering top-tier performance for demanding trading setups[8].
QuantVPS is also compatible with advanced platforms like Sierra Chart, MultiCharts, and Trading Technologies[8], which can calculate tick values and execute trades automatically based on your parameters. To keep everything running smoothly, QuantVPS offers 24/7 support and continuous system monitoring[8]. Whether through live chat, ticket submissions, or a detailed knowledge base, expert assistance is always available to resolve any issues that might impact your algorithmic trading performance[9].
With these features, QuantVPS supports both manual and automated trading strategies, making it a reliable partner for tick-based trading success.
Conclusion
As we’ve explored, understanding tick value calculations forms the backbone of any successful futures trading strategy. It’s not just about memorizing numbers – it’s about grasping how tick sizes and values directly influence your profitability. Whether you’re trading a single contract or managing hundreds, these calculations are critical. For example, the E-mini S&P 500 futures contract averages a staggering 1.81 million contracts traded daily, with each 0.25-point tick equating to $12.50 per contract [2]. Overlooking these details can mean the difference between a winning trade and a costly mistake.
This cheat sheet is designed to be your go-to resource for quick, accurate calculations. Imagine this: a 40-tick movement in crude oil translates to $400 per contract, while a 30-point drop in the E-mini S&P 500 equals a $1,500 shift. With consistent practice and reliable references, these numbers will become second nature, helping you make informed decisions in real time.
Key Takeaways for CME Futures Traders
Tick values serve as a precise measure of gains and losses, allowing traders to track market movements down to the smallest increment [2]. Since each contract has its own tick size and value, understanding these nuances is essential for managing positions effectively and calculating results accurately.
Risk management also becomes more straightforward when you know the exact dollar impact of every price movement. For instance, buying an E-mini S&P 500 contract at 5,420.75 and selling at 5,430.25 yields a gain of 9.50 points × $50 = $475 (before fees) [11]. This clarity is invaluable when setting stop-loss levels and adjusting position sizes according to your risk tolerance.
Futures trading margins, typically representing just 3–12% of a contract’s notional value [7], amplify the impact of even small price changes. That’s why staying on top of your positions and using stop-loss orders is crucial. Knowing the exact dollar value of each tick movement helps you manage risk effectively and avoid unnecessary surprises [11].
How QuantVPS Enhances Tick-Based Trading
In today’s fast-paced trading environment, technology can make or break your strategy. When milliseconds matter, having the right infrastructure ensures you don’t miss profitable moves. QuantVPS provides the computational power and connectivity needed for precise tick monitoring and execution.
With a reliable infrastructure in place, QuantVPS ensures consistent performance, giving you the confidence to execute trades seamlessly. Its compatibility with platforms like NinjaTrader, TradeStation, and Tradovate means you can integrate tick value calculations effortlessly across different systems [8].
Whether you’re manually tracking movements or running automated strategies, dependable technology eliminates unnecessary variables from the equation. This allows you to focus entirely on making informed decisions, backed by accurate calculations and solid risk management. With the right tools and knowledge in hand, you can approach every trade with confidence and precision.
FAQs
How do tick values affect my profit and loss when trading CME futures?
Tick values are a key factor in figuring out your profit and loss (P&L) when trading CME futures. Each tick represents a set dollar amount, which changes depending on the specific contract you’re trading. To calculate your P&L, you simply multiply the tick value by the number of ticks the market moves – whether in your favor or against you.
Take the E-mini S&P 500 futures as an example: one tick is worth $12.50. So, if the market moves 10 ticks, your profit or loss would be $125, depending on whether the move aligns with your position. Knowing tick values is crucial for assessing potential gains or losses, managing your risk, and shaping a solid trading strategy.
How do tick values impact margin requirements for CME futures contracts?
Tick values are the smallest price movement possible for a futures contract, and they play a crucial role in determining margin requirements. Margins are calculated as a percentage of a contract’s notional value, meaning the tick size and tick value directly impact how much profit or loss occurs with each tick. This, in turn, determines the margin needed to maintain a position.
Contracts with larger tick values often come with higher margin requirements. Why? Because each price movement results in bigger dollar-value changes, increasing the potential for gains or losses. By understanding tick values, traders can better assess their risk and figure out how much capital they need to keep their positions secure.
How can I use the tick value table to manage risk and determine position size in my trading strategy?
To make the most of the tick value table, start by pinpointing the tick size and tick value for the specific futures contract you’re trading. Next, determine your maximum risk per trade based on your comfort level. For instance, if the tick value is $12.50 and your risk tolerance is $250, divide your risk limit by the tick value. This gives you the number of ticks you can afford to lose. Use this calculation to set stop-loss levels and figure out how many contracts to trade.
Be sure to adjust your position size based on factors like the size of your trading account and how volatile the market is. This method helps you stay within your risk limits while aiming for better returns, keeping your trading strategy disciplined and consistent.


